Introduction


Simple IoT enables you to add remote sensor data, telemetry, configuration, and device management to your project or product.
Implementing IoT systems is hard. Most projects take way longer and cost more than they should. The fundamental problem is getting data from remote locations (edge) to a place where users can access it (cloud). We also need to update data and configuration at the edge in real time from any location. Simple IoT is an attempt to solve these problems by embracing the fact that IoT systems are inherently distributed and building on simple concepts that scale.
Simple IoT provides:
- A single application with no dependencies that can be run in both cloud and edge instances
- efficient synchronization of data in both directions
- Local queuing of data at the edge while a device is offline, and automatic delivery of that backlog when the connection returns
- A flexible UI to view configuration and current values
- A rules engine that runs on all instances that can trigger notifications or set data
- Extensive support for Modbus - both server and client
- Support for the Linux 1-wire subsystem.
- Flexible graph organization of instances, users, groups, rules, and configuration.
- Integration with other services like InfluxDB and Twilio
- A system that is easy to extend in any language using NATS.
- A number of useful Go packages to use in your custom application
See vision, architecture, and integration for addition discussion on these points.
See detailed documentation for installation, usage, and development information.
Motivation
This project was developed while building real-world IoT applications and has been driven by the following requirements:
- Data (state or configuration) can be changed anywhere — at edge devices or in the cloud and this data needs to be synchronized seamlessly between instances. Sensors, users, rules, etc. can all change data. Some edge systems have a local display where users can modify the configuration locally as well as in the cloud. Rules can also run in the cloud or on edge devices and modify data.
- Data bandwidth is limited in some IoT systems — especially those connected with Cat-M modems (< 100Kb/sec). Additionally, connectivity is not always reliable, and systems need to continue operating if not connected.
- Data collected while a device is offline still needs to reach the cloud. Every instance writes to a local store first, so sensor readings, configuration changes, and history are queued while the link is down and delivered in order once it comes back.
Core ideas
The process of developing Simple IoT has been a path of reducing what started as a fairly complex IoT system to simpler ideas. This is what we discovered along the way:
- Treat configuration and state data the same for purposes of storage and synchronization.
- Represent this data using simple types (Nodes and Points).
- Organize this data in a graph.
- All data flows through a message bus.
- Run the same application in the cloud and at the edge.
- Automatically sync common data between instances.
Design is the beauty of turning constraints into advantages.
- Ava Raskin
These constraints have resulted in Simple IoT becoming a flexible distributed graph database optimized for IoT datasets. We’ll explore these ideas more in the documentation.
Support, Community, Contributing, etc.
Pull requests are welcome - see development for more thoughts on architecture, tooling, etc. Issues are labeled with “help wanted” and “good first issue” if you would like to contribute to this project.
For support or to discuss this project, use one of the following options:
- Documentation
- Simple IoT community forum
- open a GitHub issue
- Simple IoT YouTube channel
- Subscribe to our email newsletter for project updates.
If you use this project, please let us know! It is really helpful to hear from users.
License
Apache Version 2.0
Contributors
Thanks to contributors:
Made with contrib.rocks.
Installation
Simple IoT will run on the following systems:
- ARM/x86/RISC-V Linux
- MacOS
- Windows
The computer you are currently using is a good platform to start with as well as any common embedded Linux platform like the Raspberry PI.
If you needed an industrial class device, consider something from embeddedTS
like the TS-7553-V2.
The Simple IoT application is a self contained binary with no dependencies. Download the latest release for your platform and run the executable. On Linux and MacOS, the download needs to be marked executable first:
chmod +x simpleiot-vX.Y.Z-linux-x86_64
./simpleiot-vX.Y.Z-linux-x86_64
Renaming it to siot is convenient if you plan to keep it in your PATH.
Once running, you can log into the user interface by opening http://localhost:4223 in a browser. The default login is:
- user:
admin - pass:
admin
Change this password before the instance is reachable by anyone else, and set
SIOT_AUTH_TOKEN; until a token is set, the NATS and HTTP interfaces accept
connections without credentials. The
deployment checklist has the full
list.
Simple IoT self-install (Linux only)
Simple IoT self-installation does the following:
- creates a Systemd service file
- creates a data directory, readable by the service user only
- generates an auth token into
siot.envin the data directory (mode0600), which the service reads; an existing file is kept on reinstall - starts and enables the service
To install as user, copy the siot binary to some location like
/usr/local/bin and then run:
siot install
To install as root:
sudo siot install
The default ports are used (HTTP on 4223, NATS on 4222); to move them, set
SIOT_NATS_PORT in the generated siot.service file, and the other ports
follow it. The siot command line tools need the token from siot.env, for
example
siot log -token $(sed -n 's/^SIOT_AUTH_TOKEN=//p' /var/lib/siot/siot.env).
A root install adds systemd sandboxing: the service cannot gain privileges, sees
the rest of the system read-only, and may write only its data directory and the
directory its binary lives in (for siot update). A client that needs hardware
access has to be allowed it in a drop-in, for example for a serial port:
sudo systemctl edit siot
[Service]
SupplementaryGroups=dialout
DeviceAllow=/dev/ttyUSB0 rw
systemd-analyze security siot shows what the unit still allows.
Updating
Simple IoT can update itself to the latest release:
siot update
This downloads the release for the platform it is running on, verifies it
against the checksums published with the release, and replaces the binary in
place. The new binary is written to the directory the current one lives in, so
if Simple IoT is installed somewhere like /usr/local/bin, run
sudo siot update. To see what is available without installing it, use:
siot update -check
The new version starts running the next time Simple IoT starts, so if it is installed as a service, restart the service:
systemctl restart siot
Updating replaces the executable and leaves the data directory alone, so
configuration and historical data carry forward. The previous binary is removed
once the new one is in place, so keep a copy if you want to be able to return to
it. On Windows, the previous version is left alongside the new one as
siot.exe.old.
Note that siot update updates the Simple IoT application itself. To update the
operating system on an embedded device, see the update client.
Cloud/Server deployments
When on the public Internet, Simple IoT should be proxied by a web server like Caddy to provide TLS/HTTPS security. Caddy by default obtains free TLS certificates from Let’s Encrypt and ZeroSSL with automatic fallback if one provider fails.
There are Ansible recipes available to deploy Simple IoT, Caddy, InfluxDB, and Grafana that work on most Linux servers.
Video: Setting up a Simple IoT System in the cloud
Building images
An image that runs Simple IoT on many units needs each unit to end up with its
own identity and credential. Ship a provisioning file (see
provisioning) with a sync node
that carries an enrollToken and no authToken; each unit generates its own
key on first start and
enrolls itself with the upstream. Do
not ship device.nkey in a shared image, since every unit would then be the
same device.
Yocto Linux
Yocto Linux is a popular edge Linux solution. There is a BitBake recipe for including Simple IoT in Yocto builds.
Networking
By default, Simple IoT runs an embedded NATS server and the SIOT NATS client is
configured to connect to nats://127.0.0.1:4222.
Use Cases
Simple IoT is platform that can be used to build IoT systems where you want to synchronize data between a number of distributed devices to a common central point (typically in the cloud). A common use case is connected devices where users want to remotely monitor and control these devices.
Some examples systems include:
- Irrigation monitoring
- Alarm/building control
- Industrial vehicle monitoring (commercial mowers, agricultural equipment, etc.)
- Factory automation
SIOT is optimized for systems where you run Embedded Linux at the edge and have fairly complex config/state that needs synchronized between the edge and the cloud.
Changes can be made anywhere
Changes to config/state can be made locally or remotely in a SIOT system.
Devices keep working when the connection drops
Edge devices are often on cellular or shared networks where outages are a normal part of operation. A SIOT instance does not depend on its upstream to run: it writes every point to its own local store first, then replicates that store upstream. Sensor readings, rule activity, and configuration changes made while the link is down are queued on disk and delivered in order when it returns. Replication picks up at the point it stopped, so only the missed data is sent, which matters on a metered or low bandwidth connection.
The same applies in the other direction. Configuration changed in the cloud for a device that is offline, or one that has not been deployed yet, waits until the device connects.
How long a device can be offline and still catch up in full depends on how much history the store keeps. The store retains a bounded number of points per value (20,000 by default), and the limit is adjustable, so a device that samples slowly can be offline far longer than one writing every second. See Synchronization for setting up an upstream connection, Store for the retention setting, and the synchronization reference for the mechanics of queuing and catch-up.
Integration
There are many ways to integrate Simple IoT with other applications.
There are cases where some tasks like machine learning are easier to do in languages like C++, then you can connect these applications to SIOT via NATS to access config/state. See the Integration reference guide for more detailed information.
Multiple upstreams
Because we run the same SIOT application everywhere, we can add upstream instances at multiple levels.
This flexibility allows us to run rules and other logic at any level (cloud, local server, or edge gateway) - wherever it makes sense.
User Interface
Contents
Basic Navigation
After Simple IoT is started, a web application is available on port :4223
(typically http://localhost:4223). After logging in
(default user/pass is admin/admin), you will be presented with a tree of
nodes.
The Node is the base unit of configuration. Each node contains Points which
describe various attributes of a node. When you expand a node, the information
you see is a rendering of the point data in the node.
You can expand/collapse child nodes by clicking on the arrow to the left of a node.
You can expand/edit node details by clicking on the dot to the left of a node.
Live updates
The page keeps one connection to the server and shows changes as they happen: a
value a device reports, a node someone else adds, or a setting you change in
another tab appear without a refresh. Expanding a node fetches its children, and
the arrow shows a spinner until they arrive; expanding again after collapsing
fetches them afresh. A connecting... badge next to the logo means the
connection is down and the page is trying again; when it is back, what is on
screen is fetched again. Being removed from a group, or a password change,
closes the connection, and an expired sign-in returns you to the sign-in page.
Adding nodes
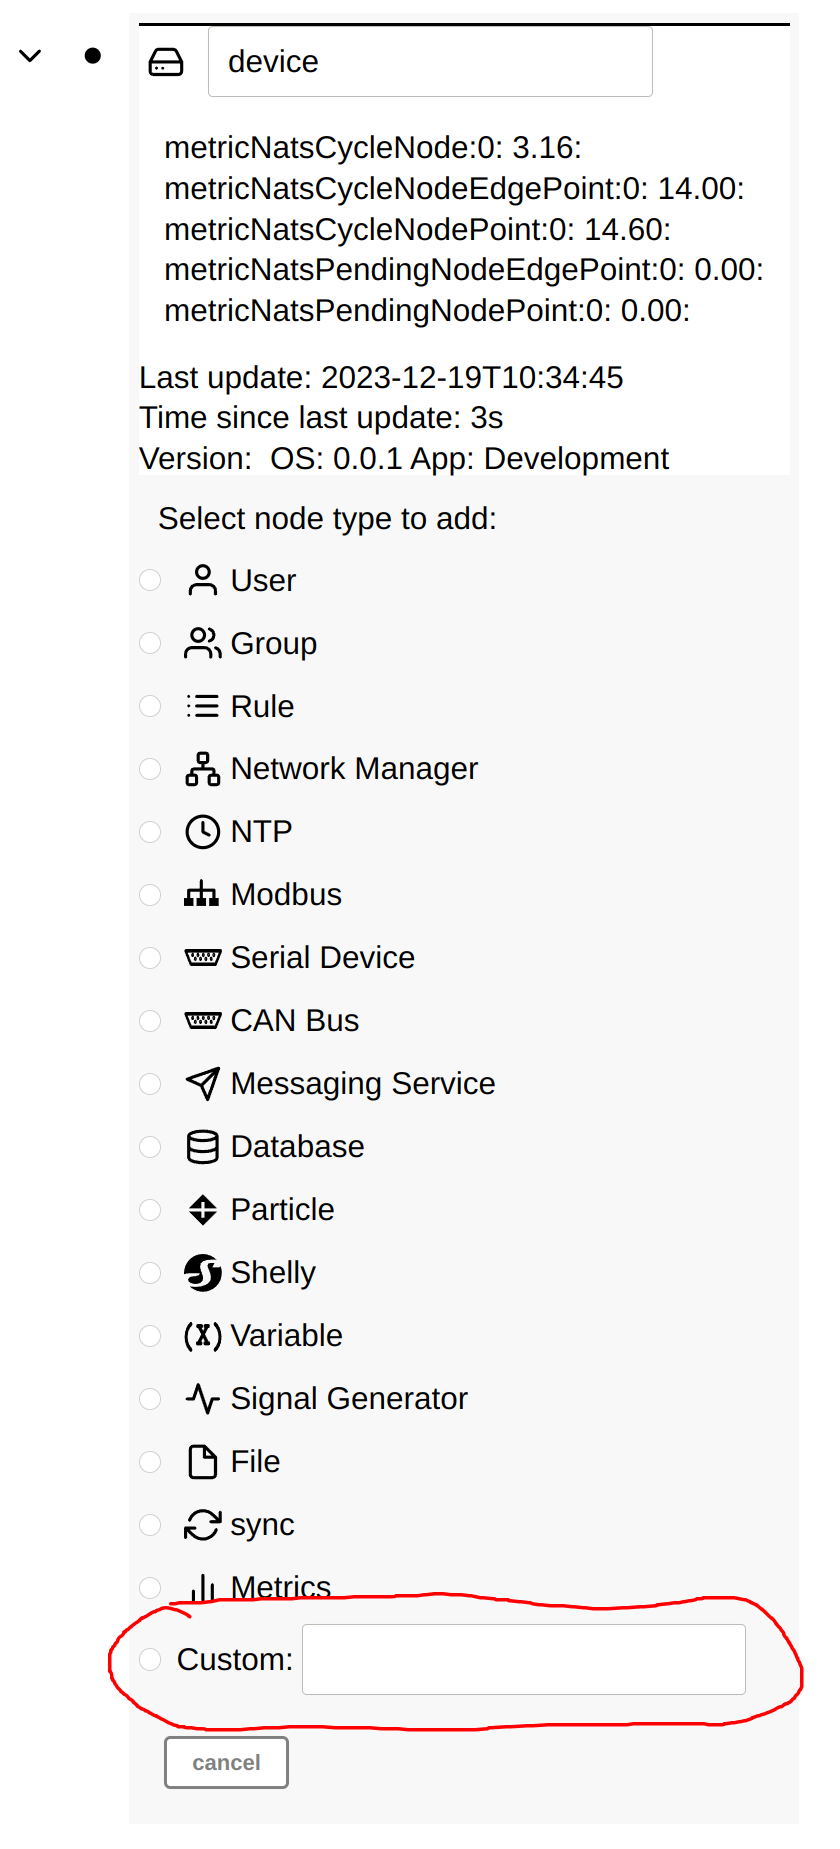
Child nodes can be added to a node by clicking on the dot to expand the node, then clicking on the plus icon. A list of available nodes to add will then be displayed:
Some nodes are populated automatically if a new device is discovered, or a downstream device starts sending data.
Deleting, Moving, Mirroring, and Duplicating nodes
Simple IoT provides the ability to re-arrange and organize your node structure.
To delete a node, expand it, and then press the delete icon.
To move or copy a node, expand it and press the copy icon. Then expand the destination node and press the paste icon. You will then be presented with the following options:
move- moves a node to new locationmirror- is useful if you want a user or device to be a member of multiple groups. If you change a node, all the mirror copies of the node update as well.duplicate- recursively duplicates the copied node plus all its descendants. This is useful for scenarios where you have a device or site configuration (perhaps a complex Modbus setup) that you want to duplicate at a new site.
After a mirror or a duplicate, the copied node stays on the clipboard, so you can paste it into several destinations in a row, such as mirroring a shared variable into each device at a site. A move clears it. Press the x next to the clipboard entry at the top of the page to clear it yourself.
Mirroring a node that talks to hardware (a Modbus IO, a Shelly IO, a GPIO line, an MQTT connection) gives you a view of it rather than a second copy that runs. The instance where the node actually lives keeps talking to the device, and the mirror displays the same values wherever you put it. This is what makes it safe to mirror a sensor from inside a device into a group you share with someone, and mirrors are labeled in the tree so it is clear that nothing runs there. Controls still work from a mirror: setting a value on one travels to the device that owns the node, and the result comes back.
Mirroring a node into several devices shares it with all of them. A setpoint or schedule kept on the upstream and mirrored into each device at a site arrives on every one, and a change made in the portal reaches them all. Each device sees the current values as soon as the mirror is added, and removing a mirror removes the node from that device only. A change made on one device reaches the upstream but not the other devices, so keep values that several devices depend on where they are set: on the upstream. See a node reaches every device it is mirrored into.
Some nodes belong under a particular parent and are found through it: a Modbus
IO under its Modbus node, a rule condition under its rule. For these, mirror
is the only option offered, because moving one somewhere else would leave it
where nothing looks for it.
Deleting a node where it lives also removes its mirrors, so a deleted sensor does not leave entries behind in the groups it was mirrored into. Removing a mirror leaves the node itself alone.
If you have mirrors that were created before this behavior existed, they keep working the way they did. To bring one up to date, remove the mirror and mirror it again from the node where it lives.
Raw Node View
If a node is expanded, a raw node button is available that allows you to view the raw type and points for any node in the tree. It is useful at times during development and debugging to be able to view the raw points for a node.
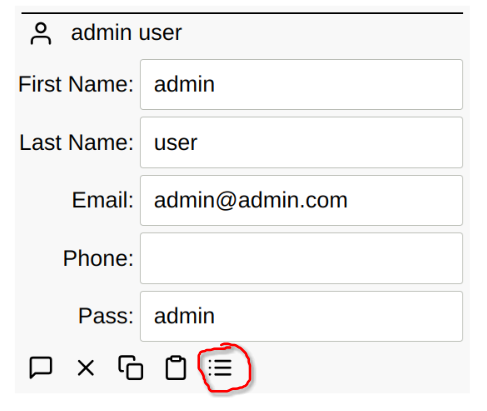
After the raw button is pressed, the type and points are displayed:
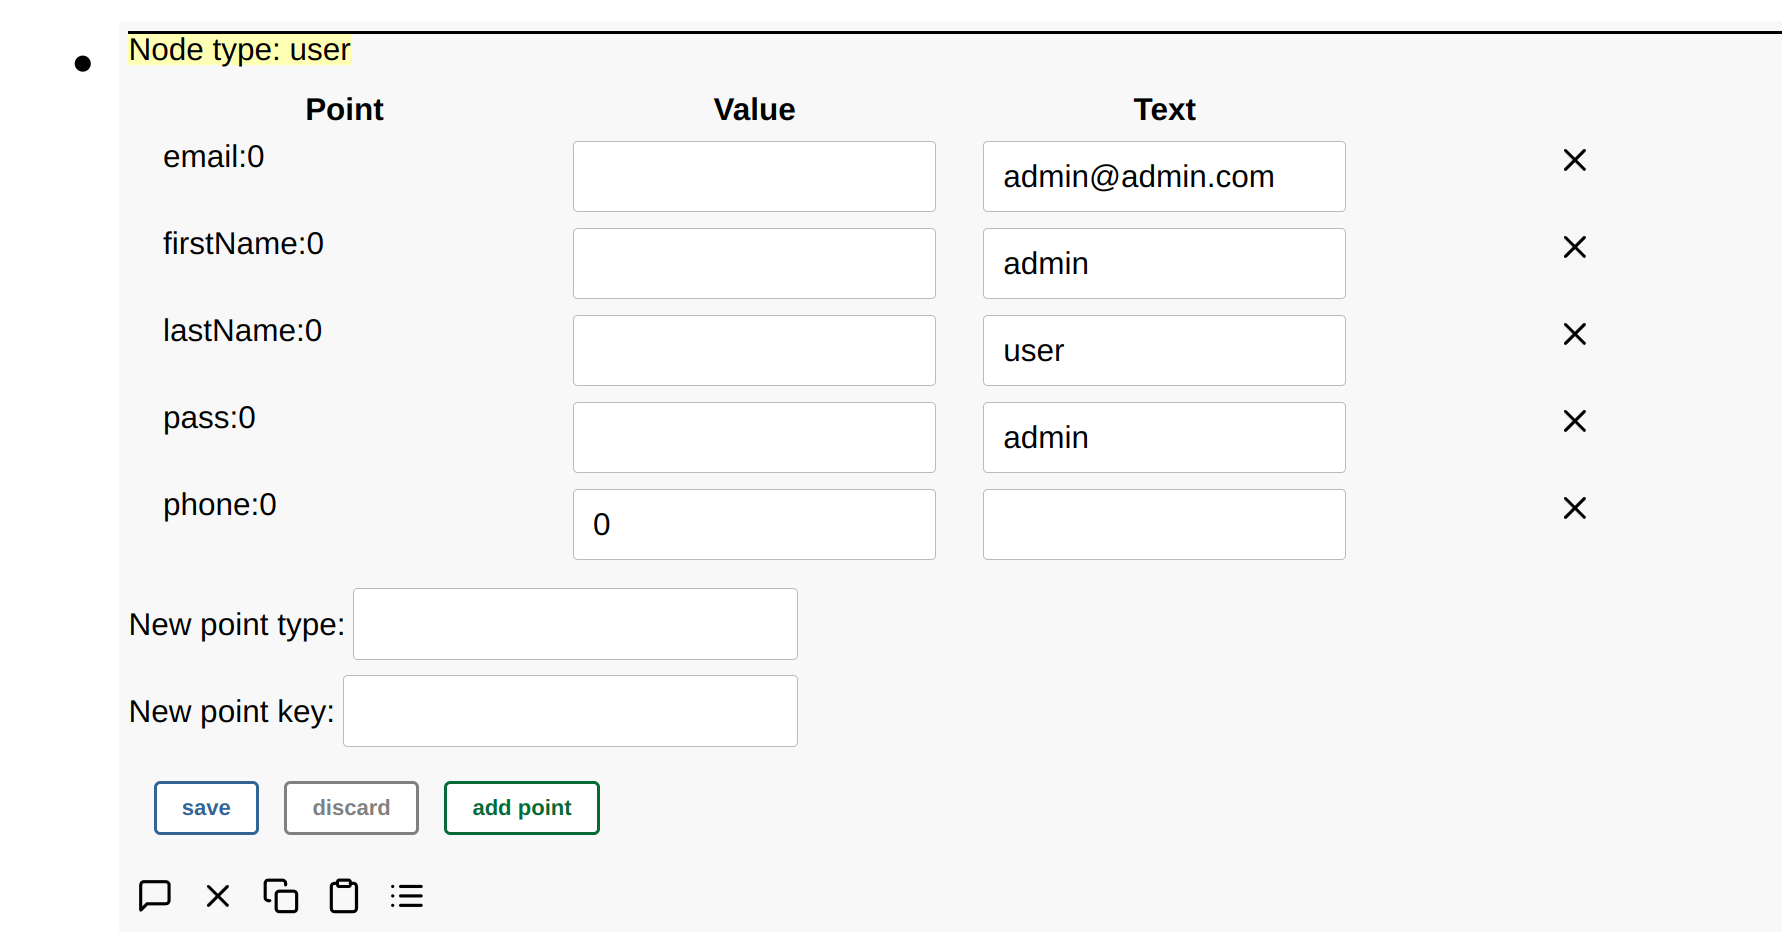
Unknown nodes will also be displayed as raw nodes.
Points can also be edited, added, or removed in raw mode.
A custom node type can also be added by specifying the node type when adding a node. This can be useful when developing new clients or external clients that run outside of the SImple IoT application.
Graphing and advanced dashboards
If you need graphs and more advanced dashboards, consider coupling Simple IoT with Grafana. Someday we hope to have dashboard capabilities built in.
Custom UIs
See the frontend reference documentation.
Users/Groups
Users and Groups can be configured at any place in the node tree. The way
permissions work is users have access to the parent node and the parent nodes
children. In the below example, Joe has access to the SBC device because
both Joe and SBC are members of the Site 1 group. Joe does have access
to the root node.
If Joe logs in, the following view will be presented:
Schema
The configuration of a group and a user in it:
nodes:
  - group:
      description: Site 1
  - user:
      parent: Site 1
      email: joe@example.com
      firstName: Joe
      lastName: Smith
      pass: his-password
      phone: "+12155551212"
      edgePoints:
        role: admin
A group carries a description and nothing else. Its place in the tree is what gives it meaning, and the users and devices below it are what it groups.
A user is the one node type with no description, so a file finds it by email,
and by name when there is no email. phone is written as text so the leading
+ is kept.
role is admin or user and lives under edgePoints rather than with the
points, because a role belongs to the connection between the user and the node
above rather than to the user. The same user mirrored into two places can hold a
different role in each.
Passwords
A password is stored as a bcrypt hash, never as the plaintext value. A pass
value written through the UI, the API, an import, or a provisioning file is
hashed before it is stored, so the store, sync streams, and exports carry only
the hash. A password stored in plaintext by an earlier release keeps working and
is converted to a hash the next time that user signs in.
An export carries pass as the stored hash, which cannot be converted back to
the password. A plaintext pass in an import file is hashed when it is applied,
so a file that sets passwords should still be treated with care until it is
applied and deleted.
The password field in the UI shows blank rather than the stored hash; typing in it sets a new password.
Where a user signs in
A user belongs to the instance whose tree holds it, and signs in there. A user
under a device node is that device’s user: when the device syncs to an upstream,
the user is replicated there with the rest of the device’s tree and appears
under the device in the upstream’s UI, but is not accepted at the upstream’s
sign-in. Setting that user’s password from the upstream changes the password on
the device, and does not make the user an account on the upstream. A user who
needs the upstream is created under the upstream’s root or one of its groups.
This also means a device still carrying the default admin account is not a way
into its upstream.
Sign-in attempts are limited per account: after five failures in a row the account is refused for a second, doubling with each further failure up to five minutes, and every failure is logged.
Notifications
Notifications are sent to users when a rule goes from inactive to active and contains a notification action, or when a user sends a message from the web UI. This notification travels up the node graph. At each parent node, users potentially listen for notifications. If a user is found, then a message is generated. This message likewise travels up the node graph. At each parent node, messaging service nodes (Twilio SMS, email) potentially listen for messages and then process the message. Each node in Simple IoT that generates information is not concerned with the recipient of the information or how the information is used. This decoupling is the essence of messaging based systems (we use NATS) and is very flexible and powerful. Because nodes can be aliased (mirrored) to different places, this gives us a lot of flexibility in how points are processed. The node tree also gives us a very visual view of how things are connected as well as an easy way to expand or narrow scope based on high in the hierarchy a node is placed.
Example
There is hierarchy of nodes in this example system:
- Company
XYZ- Twilio SMS
Plant A- Joe
- Motor overload Rule
Line #1- Motor Overload
Plant B
The node hierarchy is used to manage scope and permissions. The general rule is
that a node has access to (or applies to) its parent nodes, and all of its
parents dependents. So in this example, Joe has access to everything in Plant
A, and likewise gets any Plant A notifications. The Motor overload rule also
applies to anything in Plant A. This allows us to write one rule that could
apply to multiple lines. The Twilio SMS node processes any messages generated in
Company XYZ including those generated in Plant A, Line #1, Plant B, etc.
and can be considered a company wide resource.
The process for generating an SMS notification to a user is as follows:
Line #1contains aMotor Overloadsensor. When this value changes, a point (blue) gets sent to its parentLine #1and then toPlant A. Although it is not shown below, the point also gets sent to theCompany XYZand root nodes. Points always are rebroadcast on every parent node back to the root.Plant Acontains a rule (Motor Overload) that is then run on the point, which generates a notification (purple) that gets sent back up to its parent (Plant A).Plant Acontains a userJoeso a notification + user generates a message (green), which gets sent back upstream toPlant Aand then toCompany XYZ.Company XYZcontains a messaging service (Twilio SMS), so the message gets processed by this service an SMS message gets sent toJoe.
The Motor Overload sensor node only generates what it senses. The Motor Overload
rule listens for points in Plant A (its parent) and processes those points.
The Joe user node listens for points at the Plant A node (its parent) and
processes any points that are relevant. The Twilio SMS node listens for point
changes at the Company XYZ node and processes those points. Information only
travels upstream (or up the node hierarchy).
In this example, the admin user does not receive notifications from the Twilio SMS messaging service. The reason is that the Twilio SMS node only listens for messages on its parent node. It does not have visibility into messages sent to the root node. With the node hierarchy, we can easily partition who gets notified. Additional group layers can be added if needed. No explicit binding is required between any of the nodes - the location in the graph manages all that. The higher up you go, the more visibility and access a node has.
Services Without Users
A service with a global destination does not need user nodes at all. An ntfy messaging service node publishes every notification raised in its parent’s subtree straight to its configured topic, so anyone subscribed to that topic on their phone or desktop receives it. Per-user services (Twilio SMS, email) need a user in scope to address the message; ntfy fires either way.
Duplicates
A user can be mirrored into several groups, and two branches of the tree can feed the same messaging service. Delivery is deduplicated per notification and destination address, so each user still receives one SMS or email, and each ntfy topic receives one push, no matter how many paths the notification takes through the tree.
Clients
Simple IoT is a framework that allows for clients to be added to manage IO, run rules, process data, etc. See documentation for individual clients. If you would like to develop a custom client, see the client reference documentation.
CAN Bus Client
The CAN client allows loading a standard CAN database file, receiving CAN data, and translating the CAN data into points via the database.
Usage
The CAN client can be used as part of the SimpleIoT library or through the web UI. The first step in either case is to create a CAN database in .kbc format.
Create the CAN Database
Create a file in the folder with the Go code named “test.kcd” containing the following:
<NetworkDefinition xmlns:xsi="http://www.w3.org/2001/XMLSchema-instance" xmlns="http://kayak.2codeornot2code.org/1.0" xsi:schemaLocation="Definition.xsd">
  <Document name="Some Document Name">some text</Document>
  <Bus name="sampledatabase">
    <Message id="0x123" name="HelloWorld" length="8">
      <Notes></Notes>
      <Signal name="Hello" offset="0" length="8"/>
      <Signal name="World" offset="8" length="8"/>
    </Message>
    <Message id="0x12345678" name="Food" length="8" format="extended">
      <Notes></Notes>
      <Signal name="State" offset="0" length="32"/>
      <Signal name="Type" offset="32" length="32"/>
    </Message>
  </Bus>
</NetworkDefinition>
You can create any CAN database you want by crafting it in Kvaser’s free DBC
editor and then using the canmatrix tool to convert it to KCD format. Note
that canmatrix does not support all features of the DBC and KCD formats.
Next, setup the virtual SocketCan interface.
Setup Virtual CAN Interface
Run this in the command line. Reference
sudo modprobe vcan
sudo ip link add dev vcan0 type vcan
sudo ip link set up vcan0
Option #1 - Use In Web UI
Follow the instructions to install SimpleIoT, run it, and navigate to the web UI.
Expand the root node and click the + symbol to add a sub node. Select “CAN Bus” and click “add”.
Configure the CAN Bus node with a File subnode and upload the .kcd
file you created.
Once the file has been uploaded, you should see the following stats in the CAN bus node:
Messages in db: 2 Signals in db: 4
Test with Messages
In a separate terminal:
cansend vcan0 123#R{8}
cansend vcan0 12345678#DEADBEEF
Ensure that there are no errors logged in the terminal by the application.
In the Web UI you should see the "Db msgs received" field increase to 2.
Option #2 - Use As Library
Copy this code to a Go file on your Linux machine in a folder by itself.
package main

import (
	"log"

	"github.com/nats-io/nats.go"
	"github.com/simpleiot/simpleiot/client"
	"github.com/simpleiot/simpleiot/data"
	"github.com/simpleiot/simpleiot/server"
)

// exNode is decoded data from the client node
type exNode struct {
	ID          string `node:"id"`
	Parent      string `node:"parent"`
	Description string `point:"description"`
	Port        int    `point:"port"`
	Role        string `edgepoint:"role"`
}

// exNodeClient contains the logic for this client
type exNodeClient struct {
	nc            *nats.Conn
	config        client.SerialDev
	stop          chan struct{}
	stopped       chan struct{}
	newPoints     chan client.NewPoints
	newEdgePoints chan client.NewPoints
	chGetConfig   chan chan client.SerialDev
}

// newExNodeClient is passed to the NewManager() function call -- when
// a new node is detected, the Manager will call this function to construct
// a new client.
func newExNodeClient(nc *nats.Conn, config client.SerialDev) client.Client {
	return &exNodeClient{
		nc:            nc,
		config:        config,
		stop:          make(chan struct{}),
		newPoints:     make(chan client.NewPoints),
		newEdgePoints: make(chan client.NewPoints),
	}
}

// Start runs the main logic for this client and blocks until stopped
func (tnc *exNodeClient) Run() error {
	for {
		select {
		case <-tnc.stop:
			close(tnc.stopped)
			return nil
		case pts := <-tnc.newPoints:
			err := data.MergePoints(pts.ID, pts.Points, &tnc.config)
			if err != nil {
				log.Println("error merging new points:", err)
			}
			log.Printf("New config: %+v\n", tnc.config)
		case pts := <-tnc.newEdgePoints:
			err := data.MergeEdgePoints(pts.ID, pts.Parent, pts.Points, &tnc.config)
			if err != nil {
				log.Println("error merging new points:", err)
			}
		case ch := <-tnc.chGetConfig:
			ch <- tnc.config
		}
	}
}

// Stop sends a signal to the Run function to exit
func (tnc *exNodeClient) Stop(err error) {
	close(tnc.stop)
}

// Points is called by the Manager when new points for this
// node are received.
func (tnc *exNodeClient) Points(id string, points []data.Point) {
	tnc.newPoints <- client.NewPoints{id, "", points}
}

// EdgePoints is called by the Manager when new edge points for this
// node are received.
func (tnc *exNodeClient) EdgePoints(id, parent string, points []data.Point) {
	tnc.newEdgePoints <- client.NewPoints{id, parent, points}
}

func main() {
	nc, root, stop, err := server.TestServer()

	if err != nil {
		log.Println("Error starting test server:", err)
	}

	defer stop()

	canBusTest := client.CanBus{
		ID:          "ID-canBus",
		Parent:      root.ID,
		Description: "vcan0",
		Device:      "vcan0",
	}

	err = client.SendNodeType(nc, canBusTest, "test")
	if err != nil {
		log.Println("Error sending CAN node:", err)
	}

	// Create a new manager for nodes of type "testNode". The manager looks for new nodes under the
	// root and if it finds any, it instantiates a new client, and sends point updates to it
	m := client.NewManager(nc, newExNodeClient)
	m.Start()

	// Now any updates to the node will trigger Points/EdgePoints callbacks in the above client
}
Run the following commands:
go mod init example.com/mgo run <file>.go- Run the
go getcommands suggested bygo run go mod tidygo run <file>.go
Run it!
go run <file.go>
Follow instructions from the “Test with Messages” section above.
Schema
The configuration of a CAN bus node and the file node holding its database:
nodes:
  - canBus:
      bitRate: "250000"
      description: Vehicle bus
      device: can0
      children:
        - file:
            binary: 0
            data: |
              <NetworkDefinition xmlns="http://kayak.2codeornot2code.org/1.0">
                <Bus name="sampledatabase">
                  ...
                </Bus>
              </NetworkDefinition>
            description: Vehicle database
            name: vehicle.kcd
device is the SocketCAN interface name and bitRate is text, so it is quoted.
The database rides along in the data point of the child file node, which is
what makes an export of a CAN node enough to recreate it elsewhere. See the
File client for the rest of that node.
The message and signal counts and the received counts shown in the UI are points the client maintains, so an export of a running node carries them as well.
Future Work
- Scale and translate messages based on scale and offset parameters in database
- Auto connect to CAN bus in case it is brought up after SIOT client is started
- Attempt to bring up CAN bus within client, handle case where it is already up
- Support multiple CAN database files per node (be selective in which internal db is updated when a name or data point is received in the client)
- Support sending messages (concept of nodes and send/receive pulled from databases??)
- Support
.dbcfile format in addition to.kcd - Add the concept of a device to the CAN message points
File
The file node can be used to store files that are then used by other nodes/clients. Some examples include the CAN and Serial clients.
The default max payload of NATS is 1MB, so that is currently the file size limit, but NATS can be configured for a payload size up to 64MB. 8MB is recommended.
See the Frontend documentation for more information how the file UI is implemented.
If the Binary option is selected, the data is base64 encoded before it is
transmitted and stored.
Schema
The configuration of a file node:
nodes:
  - file:
      binary: 0
      data: |
        nodes:
          - group:
              description: Tank farm
      description: Tank farm groups
      name: 10-groups.yaml
description is what names the node in the tree and name is the file name, so
the two are separate and either can change without the other. The contents live
in the data point, written as a YAML block scalar when the file has several
lines, and base64 encoded first when binary is set.
The client maintains three more points, so an export of a running node carries
them as well and an imported file settles on the right values without them being
given: hash is the MD5 of the contents, size is their length in bytes, and
created is a Unix timestamp written once when the node comes into existence,
which is what orders provisioning
files uploaded through the UI.
Database Client
The main SIOT store is NATS JetStream, which retains a bounded history of points for each node. For long-term storage, dashboards, and ad-hoc queries, a Database client can forward points to an external time-series database.
VictoriaMetrics is the primary time-series store for SIOT. The Database client speaks the InfluxDB v2 write API, which VictoriaMetrics supports, so InfluxDB 2.x can also be used.
Reliable delivery with durable consumers
The Database client reads points from the store’s JetStream streams using durable consumers rather than subscribing to live message traffic. A durable consumer is a named position in a stream that the NATS server persists to disk alongside the stream data. The client acknowledges each message only after the database has accepted the points it carried, and the server advances the saved position only on acknowledgment.
This makes delivery resumable. If the Database client, the SIOT instance, or the connection to the database is down for a period of time, points continue to accumulate in the streams. When the client comes back, delivery resumes from the saved position and the missed points are written to the database. Each Database node keeps its own position, so multiple Database clients can consume the same streams independently.
Two limits apply:
- Stream retention bounds how far behind a client can fall. By default the store keeps the last 20,000 points per subject (one subject is one point type and key on one node). If a client is down long enough that a signal exceeds this limit, the oldest points for that signal are dropped from the stream and will be missing from the database.
- High-rate points are not stored in streams. They are delivered live and are not recovered after downtime, including downtime of the database itself.
A newly added Database node starts recording from the present; it does not backfill history already in the streams. Streams that appear after the client starts, such as the replica stream for a newly adopted device, are consumed from their beginning so the device’s initial catch-up is captured.
When the database is unavailable
The same mechanism covers an outage in the time-series database itself. If VictoriaMetrics is stopped, restarted, upgraded, or simply unreachable across the network, points sent during that window are written once it comes back and the recorded history has no gap.
The stream that already holds the points serves as the buffer, and the client’s saved consumer position records how far it has gotten. There is no separate spool file or in-memory queue in the client to size or manage. The sequence is:
- The client collects points into batches of up to 500 and writes at least once a second, so each batch travels as a single write request.
- It acknowledges the stream messages behind a batch only after the database accepts the write. Until then the points remain in the stream.
- A failed batch returns to the stream with a retry delay that starts at about a second and doubles up to a maximum of one minute. The client makes no further connection attempts until the delay expires, so an outage lasting hours costs about one attempt per minute.
- Meanwhile points keep arriving and accumulate. Up to 5000 may be outstanding at once; beyond that, JetStream stops delivering to this client and the rest wait in the stream.
- When the database answers again, the held points are redelivered and written. Each point carries its original timestamp, so the history fills in at the times the readings happened.
Restarting SIOT during an outage is safe: none of the affected points were acknowledged, so they are still in the stream and arrive again on the next run. Stopping the client returns anything it had taken from the stream but had not yet written.
Rejections work differently. Bad credentials or a line the database cannot parse would fail identically on every attempt, so the client logs those points and drops them instead of blocking everything behind them.
Three log messages describe this behavior, each prefixed with the Database node’s description:
Db client site db: database write failed, holding points in the stream until it recovers: ...
Db client site db: database write succeeded after 4 failed attempts
Db client site db: dropping 37 points the database rejected: ...
The first appears once when an outage starts, not on every attempt. The second confirms recovery and how many attempts it took, and the third reports points that were discarded.
The limits above still apply: an outage that outlasts stream retention for a fast-changing signal loses that signal’s oldest points, and high-rate points are not buffered at all.
Choosing a database type
Add a Database node and choose the database type: InfluxDB 2.x or Victoria Metrics. Both are written using the InfluxDB version 2 line protocol, so the connection settings are similar, but the two differ in what they store and in how you graph the result. Existing Database nodes have no database type set and continue to behave as InfluxDB.
A third option, TimescaleDB, is described below as a planned addition. It is not implemented.
Victoria Metrics
Set the database type to Victoria Metrics and set the URI to the write endpoint,
typically http://myserver:8428 for a single-node instance. VictoriaMetrics has
no concept of an organization or a bucket, so those fields are hidden when this
type is selected.
A single-node VictoriaMetrics has no authentication on the write path, so the
Auth Token field can be left blank. VictoriaMetrics expects authentication to be
handled by vmauth or vmgateway in
front of it. The client sends the token as an Authorization: Token <token>
header, which is one of the formats vmauth accepts, so setting the Auth Token
here works when you point the URI at vmauth.
VictoriaMetrics
does not support storing strings;
it
converts any non-numeric field value to 0.
The client therefore writes only the numeric value field and skips string
points, which keeps a points_text series of zeros out of the database. If you
want to filter or graph on a value, publish it as a number. The
GPS client does this for its fix status points for exactly this
reason.
Each point arrives in VictoriaMetrics as the metric points_value, with the
point type and key and all of the node tags described below available as
labels.
Query latency offset
New points typically reach VictoriaMetrics within a second, because the write
client sends a batch every second (or sooner once 500 points accumulate).
Queries, however, do not see them for another 30 seconds by default:
VictoriaMetrics shifts the end of every query range back by
-search.latencyOffset,
which defaults to 30s so that slow Prometheus scrapes are still counted.
To see data as soon as it is written, start VictoriaMetrics (or vmselect in a
cluster) with:
victoria-metrics -search.latencyOffset=0s
Use a small value such as 1s if the clocks on the writing devices and the
database server may differ slightly. The offset can also be set per request with
a latency_offset=0s URL parameter, which in Grafana can be added to the data
source’s custom query parameters when changing the server flag is not an option.
Setting the flag under systemd
Most Linux packages run VictoriaMetrics from a systemd unit that reads extra flags from an environment file, so the flag belongs there rather than in the unit itself. Check which file your unit uses:
systemctl cat victoriametrics.service
A packaged unit typically contains lines such as:
EnvironmentFile=/etc/default/victoriametrics
ExecStart=/usr/bin/victoria-metrics -storageDataPath /var/lib/victoriametrics $ARGS
Add the flag to the variable that ExecStart expands, ARGS in this example,
by editing /etc/default/victoriametrics:
ARGS="-search.latencyOffset=0s"
Separate additional flags with spaces inside the quotes. Then restart the service and confirm the setting, which appears in the list of flags that differ from their defaults:
sudo systemctl restart victoriametrics
curl -s localhost:8428/flags
Keeping the flag in the environment file means a package upgrade can replace the
unit without discarding the setting. Distributions vary: some use
/etc/sysconfig/victoriametrics or a different variable name, and a unit with
no EnvironmentFile needs a drop-in override created with
sudo systemctl edit victoriametrics.service that sets ExecStart to the full
command line.
Graphing Victoria Metrics data
Use Grafana with a Victoria Metrics (Prometheus-compatible) data source and
query points_value with MetricsQL. See the
Graphing documentation for how the node tags map to graph labels.
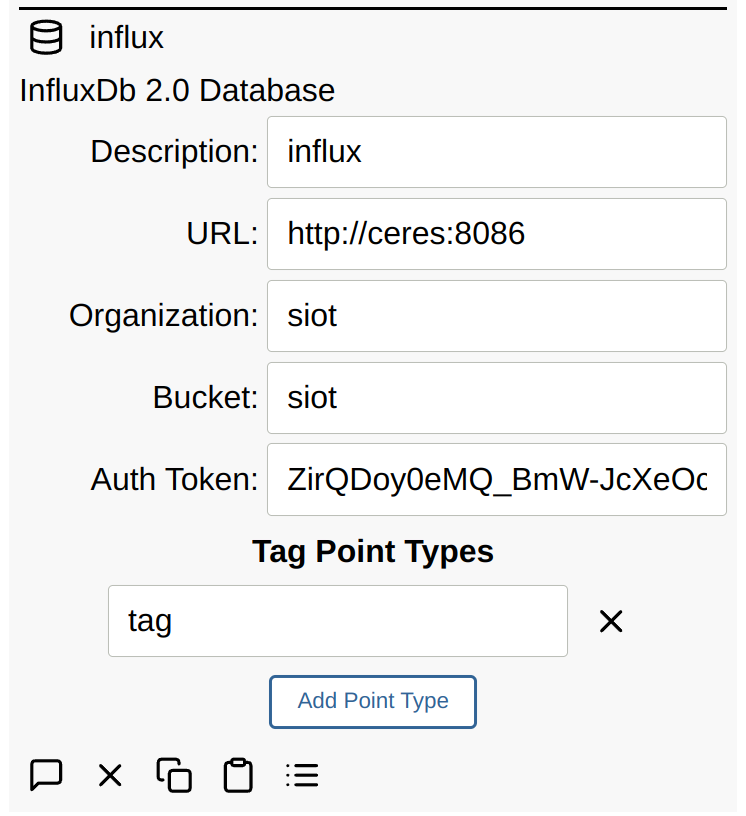
InfluxDB 2.x
Point data can also be stored in an InfluxDB 2.x database by adding a Database node:
TimescaleDB (planned)
Support for TimescaleDB is not implemented. This section describes what it would look like so the design can be discussed on the community forum before the work starts.
TimescaleDB is PostgreSQL with time-series extensions, which makes it different from the two options above in ways that matter:
- It stores text. Points carrying strings are skipped today, because VictoriaMetrics converts non-numeric values to zero. A batch or lot number, a barcode read, an operator ID, or a machine state written as text would be stored and queryable. See text data for where this comes up with industrial equipment.
- It is relational. Point history can be joined against tables you already keep, such as work orders, product definitions, or maintenance records, without moving either side.
- It downsamples and ages data on its own through continuous aggregates, compression, and retention policies, all configured in the database rather than in Simple IoT.
How points would map
One point becomes one row in a hypertable, which is close to the point model already, so little has to be invented:
-- planned, subject to change
CREATE TABLE points (
    time    TIMESTAMPTZ      NOT NULL,
    node_id UUID             NOT NULL,
    type    TEXT             NOT NULL,
    key     TEXT             NOT NULL DEFAULT '',
    value   DOUBLE PRECISION,
    text    TEXT,
    tags    JSONB
);
SELECT create_hypertable('points', 'time');
The tags column holds the same tags described above, including the ones
inherited from ancestor nodes, so a query selects on tags->>'node.tag.machine'
where a MetricsQL query would select on a label. The client would create the
table on first use if the database role allows it, and otherwise log the
statements for you to run.
Configuration
The connection settings differ from the InfluxDB ones, since PostgreSQL uses a connection URI and a database role rather than an organization, bucket, and token:
# planned, subject to change
nodes:
  - db:
      dbType: timescale
      description: TimescaleDB
      uri: postgres://siot@db.example.com:5432/siot
      authToken: password
      tagPointType: tag
Graphing
Grafana reads TimescaleDB through its PostgreSQL data source, and queries are SQL rather than MetricsQL:
SELECT time_bucket('1 minute', time) AS bucket,
       avg(value)
FROM points
WHERE type = 'value'
  AND tags->>'node.tag.machine' = 'press-3'
  AND $__timeFilter(time)
GROUP BY bucket
ORDER BY bucket;
Things to weigh
- PostgreSQL is heavier than VictoriaMetrics at the edge. VictoriaMetrics runs as a single binary on a small device with little tuning. TimescaleDB is a better fit for a server or cloud instance, so this is an addition to the options rather than a replacement for them.
- Check the licensing for the features you want. Hypertables are available under the Apache 2.0 edition, while compression, continuous aggregates, and retention policies are part of the Community edition under the Timescale License.
- Retention and rollups move into the database. That is an advantage once configured, and something to configure that the other two options do not ask for.
Tags
Tags are the labels you filter and group by when querying or graphing. Every
point written to the database carries the point’s own type and key, plus
three tags describing the node that emitted it:
node.id, the node’s ID (typically a UUID)node.type, the node type, such assignalGeneratorormodbusIonode.description, the node’s Description field
These are always present and need no configuration. Anything beyond them (which machine a reading came from, which site a machine sits at) is added by turning node points into tags, described next.
Adding custom tags
Custom tags come from points on the node, so adding one takes two steps: put the point on the node that should carry the label, then tell the Database node which point types become tags.
Step 1: add a tag point to the node. Most node types have a Tags field
with an Add Tag button. Enter a name, which becomes the tag’s key, then fill
in its value. Naming a tag machine and setting it to press-3 adds a tag
point with key machine and text press-3 to that node. The example below adds
a machine tag to the signal generator producing the data.
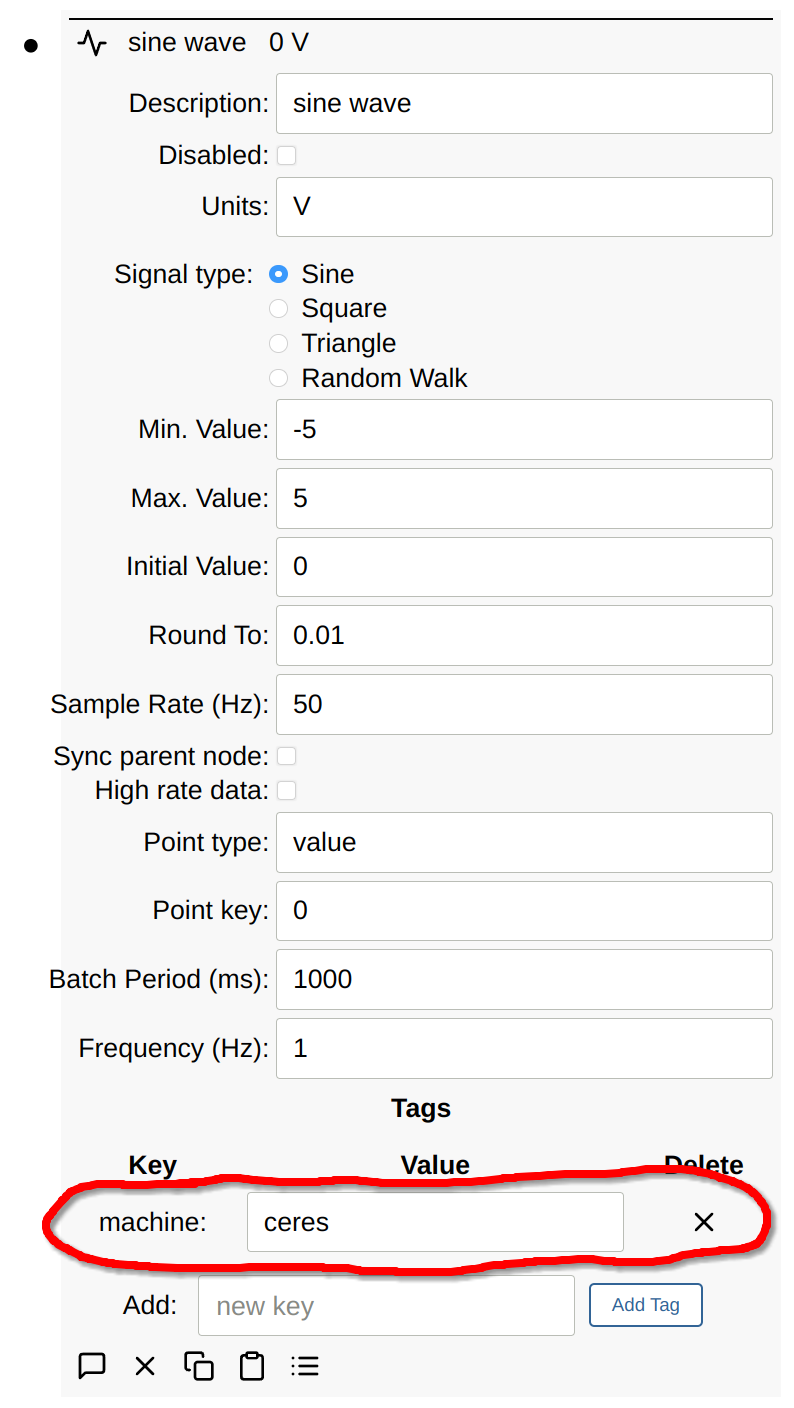
Step 2: list the point type on the Database node. The client turns a point
into a tag only when its type appears in this list. Open the Database node, find
Tag Point Types, press Add Point Type, and enter tag. This is the
point type, not the tag name, so the single entry tag covers every tag added
through the Tags field, however many there are.
Result. Points flowing through the client now carry the tag, named
node.<point type>.<point key>. A tag named machine added through the Tags
field is written as node.tag.machine, since the point type is tag and the
point key is machine:
The naming rule also covers point types other than tag. If a node has a
machine point and you add machine to Tag Point Types, its points are written
as node.machine.<key>. Listing a type that a node does not have is harmless:
it contributes no tag.
Two things to know when planning tags:
- Tags apply going forward. Adding or editing a tag starts a new series in the
database from that moment, and a query spanning the change sees both the old
and the new series. The same is true of
node.description. Settle on tag names before collecting history you intend to keep. - Adding tags is inexpensive. The database indexes tag values and stores each distinct string once, so a descriptive tag repeated across millions of samples costs far less than its length suggests.
See the Graphing documentation for how to map these tags to graph labels.
Tag inheritance
One tag point can cover a whole subtree, so step 1 rarely needs repeating on
every node. Tag points are inherited from ancestor nodes, so a label can be set
once on the node that represents the thing being described (a machine group, a
device, a site), and every point emitted beneath it carries that tag. Set site
on the device node instead of on each of its sensors. For example, with tag
listed in Tag Point Types:
device        tag: site=plant-a, customer=acme
└── press-3   tag: machine=press-3, site=plant-b
    └── temp-1    tag: sensor=inlet
a point emitted by temp-1 is written with node.tag.sensor=inlet,
node.tag.machine=press-3, node.tag.site=plant-b, and
node.tag.customer=acme.
The resolution rules are:
- All tags resolve into the same flat
node.<point type>.<point key>namespace, so queries do not depend on the depth at which a tag was set. - When the same tag is defined at more than one level, the value closest to the
emitting node wins, so a local tag overrides an inherited one (
siteabove). - Inheritance stops at the Database client’s parent node, whose own tags are included. Nodes above the Database client’s scope do not contribute tags.
- A node can have more than one parent. When two ancestors at the same depth define the same tag, the node with the lowest ID wins, and the client logs the ambiguity the first time it is seen.
node.id,node.type, andnode.descriptionalways describe the emitting node and are never inherited.
Expanding key labels
Some clients write a point key that is itself a set of labels, name=value
pairs joined by commas. The Prometheus scrape in the metrics
client does this, because a Prometheus sample carries a label set and a SIOT
point carries a single key.
With Expand Key Labels on, which is the default, the Database client reads
such a key and writes each label as its own database label. A point of type
myapp_requests_total with key code=200,method=post arrives with code and
method labels alongside the tags it would otherwise carry, so it can be
grouped and filtered the way the Prometheus series it came from was:
sum by (method) (points_value{type="myapp_requests_total"})
The whole key is still written as the key tag, so a query that selects on the
complete set keeps working either way.
Three things are worth knowing:
- Only a key that is a label set is expanded. The parse is strict and all or
nothing: every comma-separated piece must be
name=valuewith a valid label name, or the key is left alone entirely. Keys such aseth0,/dev/sda, andcpu0are unaffected, which is why the setting is safe to leave on for a database receiving points from every kind of node. A key whose label value contained a comma cannot be split reliably and is declined for the same reason. - Bucket boundaries are restored to numbers. A point key cannot hold a
period, so the metrics client writes
le="0.005"asle=0_005. The Database client puts the period back onleandquantile, the two labels a query reads as numbers, sohistogram_quantileworks. No other label is rewritten, since an underscore elsewhere may well have been an underscore to begin with. - Expansion changes series identity. Adding labels to a series makes it a new series as far as the database is concerned, the same way adding a tag does. A dashboard built against scraped points before expansion was enabled sees the old series stop and a new one start.
A label named type or key is skipped, since those are the tags the client
writes itself, and the collision is logged once.
Schema
Below is an export of a Victoria Metrics node and an InfluxDB node:
nodes:
  - db:
      dbType: victoriaMetrics
      description: Victoria Metrics
      expandKeyLabels: true
      tagPointType: tag
      uri: http://localhost:8428
  - db:
      authToken: T0k3n
      bucket: siot
      dbType: influxdb
      description: InfluxDB
      org: bec
      tagPointType:
        - machine
        - tag
      uri: http://localhost:8086
dbType is victoriaMetrics or influxdb; a node with no dbType behaves as
InfluxDB. org and bucket apply to InfluxDB alone, and Victoria Metrics nodes
leave them out.
tagPointType is the Tag Point Types field described above. It is a list,
so a single point type is written as one value and several are written as a
sequence. Each entry is a point type, and the client adds it to every sample as
node.<point type>.<point key>.
expandKeyLabels is the Expand Key Labels field described above. A node
created before this setting existed has it turned on the first time the client
runs, and the value is written to the node so it can be turned off.
An export carries authToken as it was entered, so treat a file that contains
database nodes the way you would treat the token itself.
GPIO Client
The GPIO client reads or drives a single line on a Linux GPIO character device.
A door switch, a float switch, a pump enable, a status LED, and an alarm relay
are all one line each, and each one is a gpio node.
An input publishes a value point whenever the line changes. An output takes a
valueSet point, drives the line, reads it back, and publishes value. Both
work with everything downstream of a point: a rule condition can watch value,
a rule action can write valueSet, the database client records
both, and the UI graphs them.
One Node Per Line
There is no chip node with lines under it. Each line is an independent request on the chip with its own file descriptor, its own edge stream, and its own settings, so each line is a node of its own. Two things follow from that:
- A
gpionode lives next to the thing it controls. The pump enable goes in the pump group and the door switch goes in the door group, rather than under a heading that mirrors the board. - Editing one line disturbs only that line. Adding or reconfiguring a line leaves every other line on the chip requested and holding its state.
Lines are added deliberately rather than detected. A chip exposes every line the SoC has, which is 54 on a Raspberry Pi and over a hundred on some parts, and nearly all of them are either unrelated to the application or already claimed by a driver. Add a node for each line the application actually uses.
Finding the Chip and the Line
gpiodetect and gpioinfo, from
libgpiod, list
what a board offers:
$ gpiodetect
gpiochip0 [pinctrl-bcm2835] (54 lines)

$ gpioinfo gpiochip0
gpiochip0 - 54 lines:
        line   0:  "ID_SDA"   unused   input  active-high
        ...
        line  17:  "GPIO17"   unused   input  active-high
        line  18:  "GPIO18"   "my-driver" input active-high [used]
Chip accepts a chip name such as gpiochip0, a full device path such as
/dev/gpiochip0, or the chip’s label, which is the name in brackets in the
gpiodetect output. A label is worth using where an expander does not always
land on the same chip number between boots.
Line accepts either the line offset or the kernel’s name for the line, so 17
and GPIO17 select the same line above. Naming the line is more durable, since
offsets move between kernel versions and board revisions. The client publishes
the resolved lineOffset and lineName back to the node either way, so it is
always clear which line is held.
On a Raspberry Pi, the 40-pin header is on gpiochip0 on most kernels. The Pi 5
moved it, which is a good illustration of why the chip is configurable rather
than assumed.
Access to the Device
Requesting a line requires access to /dev/gpiochipN. Running Simple IoT as
root grants it; otherwise add its user to the group that owns the device, which
is usually gpio, or install a udev rule that grants the group you prefer:
SUBSYSTEM=="gpio", KERNEL=="gpiochip*", GROUP="gpio", MODE="0660"
A line already claimed by a driver cannot be requested. The Error field on the
node names the driver holding it, which is usually enough to identify the device
tree overlay or module to change.
Configuration
| Field | Values | Description |
|---|---|---|
Chip | gpiochip0, a label, a path, or sim | Which GPIO chip the line is on |
Line | offset or kernel line name | Which line on that chip |
Direction | input (default), output | Whether the client reads the line or drives it |
Bias | as is (default), pull up, pull down, disabled | Internal bias, which applies mainly to inputs |
Drive | push-pull (default), open drain, open source | Output drive mode |
Active low | boolean | Invert the line: a low line reads and drives as active |
Debounce (ms) | milliseconds | Kernel debounce for edge events, inputs only |
Poll period (ms) | milliseconds | Non-zero switches an input from edge events to polling |
Initial value | boolean | The state an output is driven to when the line is requested |
Value | boolean | Drives an output through valueSet and shows the line state |
Disabled | boolean | Release the line without deleting the node |
Debug level (0-9) | number | Logs each edge event at level 1 and above |
Bias, debounce, and per-line configuration require Linux 5.5 or later; debounce in particular requires 5.10. On an older kernel these settings are ignored or the request fails, depending on the setting and the driver.
Edge Events and Polling
An input is requested with both edges and an event handler, so a change reaches the point stream in about a millisecond with no poll timer running. This is the default and is what most lines should use.
Some lines cannot deliver edge events: expanders behind an I2C bridge, chips
still on version 1 of the kernel interface, and kernels without interrupt
support for the pin. Setting Poll period to a non-zero value switches the line
to a periodic read instead.
Either way, the client reads and publishes the line as soon as it is requested, because edge events only report changes. It also republishes the value every ten minutes even when nothing has changed, so a graph or an upstream instance always has a recent sample.
Outputs
Writing valueSet drives the line; the client then reads the line back and
publishes value. Keeping the two separate means the client’s report of the
line state can never be mistaken for a command, and a write that fails leaves
valueSet and value visibly disagreeing.
Initial value is what the line is driven to when it is requested, which
includes every restart of Simple IoT and every configuration change. Set it to
the safe state for whatever the line controls.
Writing valueSet on an input is reported in the Error field rather than
silently ignored.
Recovering From a Failed Request
When a request fails, the node reports connected false, the reason in Error,
and a rising errorCount, and the client retries with a growing delay. A line
held by a driver that has not finished loading recovers on its own, and a line
named incorrectly recovers as soon as the name is corrected, with no need to
restart anything.
Disabled releases the line, which is the way to hand a line back to the kernel
without deleting the node. What an output line does after it is released is up
to the driver: some controllers return the line to an input, and others leave it
configured and driven where it was. A Raspberry Pi 5 does the latter, so a
released output holds its last level until something else claims the line. Where
the state of a line matters when Simple IoT is not holding it, set it
deliberately before releasing it rather than relying on the release.
Trying It Without Hardware
Setting Chip to sim gives the node a simulated line instead of a kernel one.
Simulated lines are keyed by offset, and writing a simulated output delivers an
edge to every simulated input at the same offset, which behaves like a wire
between them. Two nodes at offset 1, one an output and one an input, are
enough to develop and test a rule before any hardware exists.
The simulated chip names its line at offset 7 sim7, so a simulated line can be
selected by name as well as by offset.
Published Points
| Point | Type | Description |
|---|---|---|
value | boolean | The line state as read back |
connected | boolean | Whether the line is currently requested |
lineOffset | number | Resolved offset, useful when line was given as a name |
lineName | text | The kernel’s name for the resolved line |
error | text | Why the last request or access failed |
errorCount | count | Failed requests, reads, and writes |
Schema
Below is an export of two gpio nodes, a relay output and a switch input:
nodes:
  - gpio:
      description: Pump enable
      chip: gpiochip0
      line: "17"
      direction: output
      initialValue: 0
  - gpio:
      description: Float switch
      chip: gpiochip0
      line: FLOAT_SW
      direction: input
      bias: pullUp
      debounce: 20
GPS Client
The GPS client reads position data and publishes it as points on a gps node.
It supports three sources:
- Serial reads NMEA sentences directly from a receiver on a serial port.
- gpsd subscribes to the gpsd daemon over TCP. This is a good choice on a Linux system where gpsd already manages the receiver, where several processes need the same position, or where gpsd’s device detection and driver support are useful.
- Simulated generates a plausible track without any hardware, which makes it easy to develop rules, dashboards, and graphs.
All three sources publish the same points, so anything consuming the data works the same way no matter which source is configured.
Configuration
Select the source first. The remaining fields change to match it.
Serial
| Field | Description |
|---|---|
Port | Path to the serial device, such as /dev/ttyUSB0. |
Baud | Port speed. Most receivers default to 9600. |
The client reopens the port automatically when a receiver is unplugged and plugged back in, so a USB receiver can be moved without restarting SimpleIoT.
The client reads the GGA, GSA, RMC, and VTG sentences and ignores the rest. A receiver reports one position across several of these, so the client collects a full cycle of sentences and publishes them together. Every point from one position therefore carries the same timestamp, which is what makes the data plottable on a map.
gpsd
| Field | Description |
|---|---|
gpsd address | Host and port of the daemon. Defaults to localhost:2947. |
Device | Which device to watch. Leave blank to watch whatever gpsd is serving. |
The client reconnects with a growing delay whenever the daemon becomes unreachable. It also reports itself disconnected if no position arrives for ten seconds, because gpsd keeps the connection open when a receiver goes quiet or is unplugged.
Simulated
| Field | Description |
|---|---|
Start latitude | Where the track begins, in degrees. |
Start longitude | Where the track begins, in degrees. |
Speed (m/s) | How fast the simulated receiver moves. Defaults to 10. |
Start heading (deg) | Initial direction of travel, degrees true. |
Heading drift (deg/s) | How far the heading may wander per second. Defaults to 5. |
Update period (s) | How often a position is published. Defaults to 1. |
Reset location | Moves the track back to the configured start position. |
The heading drifts randomly within the configured rate, so the track wanders
naturally instead of running straight or jumping between positions. Set the
heading drift to 0 for a straight track.
Positions follow a great circle, so tracks behave correctly at high latitudes and when crossing the antimeridian.
The simulator continues from the node’s last published position, so changing the speed, the update period, or restarting SimpleIoT picks the track up where it left off rather than returning to the start. Switching a node from a hardware source to the simulator likewise continues from the last real position.
Two things send the simulated receiver back to the configured start position:
pressing Reset location, and editing Start latitude, Start longitude, or
Start heading, which moves the receiver to the position just entered.
The simulator reports a normal GPS fix rather than marking its data as simulated, so rules and dashboards behave exactly as they would with real hardware. The node’s source setting is what identifies the data as synthetic.
Debug Levels
The Debug level field controls how much the client logs. Every source logs
connection changes and configuration problems whatever the level is set to.
| Level | Description |
|---|---|
0 | Connection changes and configuration problems only. |
2 | Adds parse, decode, and read errors, and the gpsd version banner. |
4 | Adds every message: NMEA sentences, gpsd reports, generated points. |
Level 2 is the one to reach for when a receiver is connected but no position
appears, since it names the sentence or report that could not be used. Levels
3 and above 4 behave the same as 2 and 4 respectively.
A new level takes effect on the next message. The source keeps running, so raising the level while chasing a problem leaves the serial port open, the gpsd session connected, and the simulated track where it is.
Level 4 is verbose. A receiver at the default one second period sends several
sentences per fix, so expect a handful of lines every second. The simulator has
no raw input to show, so it logs the points it generated for each fix instead,
which is a way to watch a track advance without querying the node.
Published Points
| Point | Units | Description |
|---|---|---|
latitude | degrees, positive north | Position |
longitude | degrees, positive east | Position |
altitude | meters above sea level | See the note on altitude below |
speed | meters per second | Speed over ground |
heading | degrees true, 0 to 360 | Direction of travel over ground |
fixType | numeric code | Whether the fix is 2D or 3D |
fixQuality | numeric code | Which augmentation produced the fix |
numSat | count | Satellites used in the fix |
hdop | ratio | Horizontal dilution of precision |
gpsTime | Unix epoch seconds | Time reported by the receiver |
connected | boolean | Whether data is currently arriving |
rx | count | Messages received |
errorCount | count | Messages that could not be read |
A source publishes only what it actually reports. A receiver that sends no GSA
sentences, for example, leaves fixType unset; no value is guessed for it.
Fix Type and Fix Quality
The three sources describe a fix in three different vocabularies, so the client
normalizes them into two points. fixType covers whether the fix is 2D or 3D,
which determines whether the altitude can be trusted. fixQuality covers which
augmentation produced the fix, which determines how accurate the position is.
Both are stored as numbers rather than as text, which lets them be graphed and keeps them intact in databases that store only numeric values. The web UI displays them as labels.
fixType follows the gpsd encoding:
| Value | Meaning |
|---|---|
0 | No fix, or unknown |
2 | 2D fix |
3 | 3D fix |
fixQuality follows the NMEA GGA encoding:
| Value | Meaning |
|---|---|
0 | No fix |
1 | GPS |
2 | Differential GPS |
3 | Precise Positioning Service |
4 | RTK fixed |
5 | RTK float |
6 | Estimated, or dead reckoning |
7 | Manual input |
8 | Simulated |
Values 7 and 8 are available through gpsd. The NMEA library SimpleIoT uses
validates fix quality against the range 0 to 6, so a serial receiver
reporting 7 or 8 is treated as reporting no fix. Both values are rare enough
from real receivers that this is unlikely to come up in practice.
A Note on Altitude
The serial source reports altitude above mean sea level, taken from the GGA
sentence. The gpsd source prefers gpsd’s altMSL field, which is the same
measurement, and falls back to altHAE when that is all the daemon provides.
altHAE is measured from the WGS84 ellipsoid instead, and the two differ by the
local geoid separation, which reaches tens of meters in some parts of the world.
If altitude accuracy matters for your application, check which field your gpsd
version reports.
Storing and Graphing
Add a database node to store GPS points in InfluxDB or Victoria Metrics. All the numeric points listed above are stored normally.
Plotting a Track on a Map
Grafana’s Geomap panel needs latitude and longitude as two numeric fields on the same row. The GPS client stamps every point from one position with the same timestamp, which is what allows the two to be brought back together.
With InfluxDB, a Flux pivot() puts them into one row directly:
from(bucket: "siot")
  |> range(start: v.timeRangeStart, stop: v.timeRangeStop)
  |> filter(fn: (r) =>
    r._measurement == "points" and
    r._field == "value" and
    (r.type == "latitude" or r.type == "longitude"))
  |> filter(fn: (r) => r["node.description"] == "My GPS")
  |> pivot(rowKey: ["_time"], columnKey: ["type"], valueColumn: "_value")
Set the panel’s Map Layer to Coordinates, and the latitude and longitude fields to the pivoted columns.
With Victoria Metrics, add one query per field. Set each query’s Legend to the field name, which is how the Geomap panel finds the coordinates later.
Each query selects one point type from the GPS nodes:
max by(node.description) (points_value{node.type="gps", node.description="$node", type="latitude"})
max by(node.description) (points_value{node.type="gps", node.description="$node", type="longitude"})
max by(node.description) (points_value{node.type="gps", node.description="$node", type="speed"})
$node is a dashboard variable holding the GPS node description, so one
dashboard can serve several receivers. max by(node.description) collapses the
result to one series per node.
The tag names the database client writes contain dots, as in node.type and
node.description. Victoria Metrics accepts these as label names and they can
be used directly in a query, as above.
Set Step to the GPS update rate, 1s in the example. A larger step samples
the track instead of drawing every position.
Then add two transformations:
- Join by field in
Outer (time series)mode onTime. This is where the shared timestamp matters: the separate series line up onto single rows only because every point in one fix carries the same time. - Organize fields by name, which sets the field order and confirms the names carried over from the query legends.
Finally, set the panel’s Map Layer to Coordinates. Grafana locates the
latitude and longitude fields by name.
To display the fix codes as labels on a Grafana panel, add value mappings using the tables above.
Schema
Below is an export of a simulated GPS node:
nodes:
  - gps:
      altitude: 85.3
      connected: 1
      description: Test track
      fixQuality: 1
      fixType: 3
      gpsSource: sim
      hdop: 0.92
      heading: 92.4
      latitude: 40.03567
      longitude: -75.52006
      numSat: 11
      period: 1
      simHeading: 90
      simHeadingRate: 5
      simLatitude: 40.0354
      simLongitude: -75.5198
      simSpeed: 12
      speed: 12
IIO Client
The IIO client reads analog values through the Linux Industrial I/O subsystem, which is the kernel’s framework for ADCs, DACs, and the sensors that behave like them. A 4-20 mA loop through an ADS1115, a pressure sensor on an I2C bus, a thermocouple through a MAX31856, and the accelerometer already sitting on a gateway’s board all reach Simple IoT the same way.
Each channel publishes a value point, which works with everything downstream:
a rule condition can watch it, a rule action can write valueSet on an output
channel, the database client records it, and the UI graphs it.
Devices and Channels
An iio node names one device. The channels on that device are detected and
added as iioChannel children, so adding a device node and waiting a poll
period is usually the whole setup.
Grouping the channels under the device matches what the kernel does. A channel is a set of files in a directory shared with every other channel on the device, alongside settings such as the sample frequency that apply to all of them at once. Reading them together also means the three axes of an accelerometer belong to one sample, taken at one moment.
Channels are detected rather than added by hand, because a device exposes exactly the channels it has and every one of them is something the hardware measures. A channel can still be added by hand where it is wanted: a driver that publishes only a converted value with no raw attribute needs a node created for it, and a person who wants two of a device’s eight channels can delete the rest.
Finding the Device
The devices the kernel has probed appear under /sys/bus/iio/devices:
$ cat /sys/bus/iio/devices/iio:device*/name
ads1015
lsm6dsl
iio_info, from libiio, prints
the channels each one publishes along with their attributes, which is the
quickest way to see what a device will produce.
Device accepts the driver’s name for the device, the sysfs directory name such
as iio:device0, or a full absolute path; a relative path or one containing
.. is refused. Matching by name is preferred, since the device number depends
on probe order and is not stable across boots. The client publishes the resolved
deviceName and devicePath back to the node either way, so it is always clear
which device is being read.
Many ADCs and sensors need a device tree overlay or an I2C instantiation before
they appear at all. On a Raspberry Pi, an ADS1015 on the default address is
enabled by adding this to /boot/config.txt:
dtoverlay=ads1015
A device whose driver has not probed yet is not an error the client gives up on:
it reports connected false with the reason in Error, and finds the device on
a later poll once it appears.
Access to the Device
Reading these attributes requires access to /sys/bus/iio/devices. Running
Simple IoT as root grants it; otherwise add its user to a group with access, or
install a udev rule that grants the group you prefer:
SUBSYSTEM=="iio", GROUP="iio", MODE="0660"
Writing an output channel or a device setting requires write access to the attribute, which usually needs the same rule.
Configuration
The device node:
| Field | Values | Description |
|---|---|---|
Device | ads1015, iio:device0, or a full path | Which IIO device |
Poll period (ms) | milliseconds, default 3000 | How often every enabled channel is read |
Sample frequency (Hz) | number | Written to sampling_frequency when non-zero |
Oversampling ratio | number | Written to oversampling_ratio when non-zero |
Disabled | boolean | Stop polling without deleting the node |
Debug level (0-9) | number | Logs each failed read at level 1 and above |
A channel node:
| Field | Values | Description |
|---|---|---|
Channel | in_voltage0 | The sysfs attribute prefix, filled in by detection |
Scale | number, default 1 | Applied to the converted reading |
Offset | number, default 0 | Added after Scale |
Units | text | Defaulted from the channel type, editable |
Min change | number | How far the value must move before it is published |
Value | number | Writes valueSet on an output channel |
Disabled | boolean | Skip this channel and leave the rest reading |
Units
The IIO ABI fixes the unit each channel type is reported in. Three of them are
milli units, which the client divides by a thousand so that a rule comparing a
temperature to 25 works the same against an IIO sensor as against a 1-wire
one, and a voltage graphs as 3.3 rather than 3300:
| Channel type | ABI unit | Published as | Units |
|---|---|---|---|
voltage | millivolts | volts | V |
current | milliamps | amps | A |
temp | millidegrees C | degrees C | C |
accel | m/s² | as-is | m/s^2 |
anglvel | rad/s | as-is | rad/s |
magn | Gauss | as-is | G |
pressure | kilopascals | as-is | kPa |
humidityrelative | percent | as-is | % |
illuminance | lux | as-is | lx |
proximity | unitless | as-is | empty |
| anything else | driver defined | as-is | empty |
Units is set from this table when a channel is detected and can be edited
afterward, which is what a channel scaled into engineering units needs.
Two Layers of Scale
The kernel publishes its own _scale and _offset attributes, which convert a
raw count into the ABI’s physical unit. The client applies these, preferring an
already-converted _input attribute where the driver publishes one. This is the
driver’s business and needs no configuration.
The node’s Scale and Offset sit above that and convert the physical unit
into the quantity the sensor is actually wired to measure. Keeping them separate
means a person editing a node never has to know the device’s full-scale range,
and replacing an ADS1115 with an ADS1015 changes nothing on the node.
A 4-20 mA Loop
A 4-20 mA transmitter reporting a tank level from 0 to 100 percent, read across a 100 Ω sense resistor, produces 0.4 V at the bottom of its range and 2.0 V at the top. Read as a voltage channel, that is:
Scale: 62.5, since a 1.6 V span covers 100 percentOffset: -25, so that 0.4 V lands on 0Units:%
A reading of 1.2 V then publishes as 50 percent, and a broken loop reading 0 V publishes as -25, which is visibly out of range rather than a plausible empty tank.
Publishing and Min Change
An ADC’s low bits dither on every sample, so publishing on any change would
write a point per poll forever. Min change sets how far a reading must move
from the last published one before it is sent. This is the setting to reach for
when a channel is filling the database with noise.
Underneath it, the client republishes the value every ten minutes even when nothing has changed, so a graph and an upstream instance always have a recent sample.
Output Channels
A channel detected as out_* accepts a valueSet point. The client inverts the
conversion chain to a raw count, writes it, reads the channel back, and
publishes value. Keeping the two separate means the client’s report of the
channel can never be mistaken for a command, and a write that fails leaves
valueSet and value visibly disagreeing.
Writing valueSet on an input channel is reported in the Error field rather
than silently ignored.
Sample Rate
This client polls sysfs, and is built for low-rate readings: a tank level, a
loop current, a board temperature, a battery voltage, read every second or few
seconds and published when it moves. A Poll period much below 100 ms is
outside what it is meant to do, and asking for one produces jitter rather than
faster sampling.
Sample frequency and Oversampling ratio are the settings that actually
improve a reading. Many ADCs convert continuously and a sysfs read returns the
most recent conversion, so the sample frequency decides how stale a reading can
be, and the oversampling ratio trades conversion time for noise. A device that
does not publish one of these settings reports that in the log and is not
counted as an error.
Capturing a waveform is a different problem: it means enabling scan elements, attaching a trigger, and decoding packed binary records, and it needs a data model where a point per sample does not overwhelm the store. That is not what this client does.
Published Points
| Point | Type | Description |
|---|---|---|
value | number | The converted reading, on a channel node |
connected | bool | Whether the device was found and is readable |
deviceName | text | The device’s name attribute |
devicePath | text | The resolved iio:deviceN directory |
channel | text | The attribute prefix, filled in by detection |
channelType | text | The measured quantity, filled in by detection |
direction | text | input or output, filled in by detection |
error | text | Why the device or channel could not be read |
errorCount | count | Failed resolutions, reads, and writes |
Schema
An iio node ready for siot import:
nodes:
  - iio:
      description: Tank level ADC
      device: ads1015
      pollPeriod: 1000
      sampleFrequency: 128
The channels arrive on their own once the node is imported, so what a file adds is the device and the settings that apply to it. A channel can be described in the same file where its conversion is worth carrying:
nodes:
  - iio:
      description: Tank level ADC
      device: ads1015
      pollPeriod: 1000
      children:
        - iioChannel:
            description: Tank level
            channel: in_voltage0
            channelType: voltage
            direction: input
            scale: 62.5
            offset: -25
            units: "%"
            minChange: 0.5
Modbus
Modbus is popular data communications protocol used for connecting industrial devices. The specification is open and available at the Modbus website. See also this Modbus Overview.
Simple IoT can function as both a Modbus client or server and supports both RTU and TCP transports. Modbus client/server is used as follows:
- Client: typically a PLC or Gateway - the device reading sensors and initiating Modbus transactions. This is the mode to use if you want to read sensor data and then process it or send to an upstream instance.
- Server: typically a sensor, actuator, or other device responding to Modbus requests. Functioning as a server allows SIOT to simulate Modbus devices or to provide data to another client device like a PLC.
Modbus is a prompt response protocol. With Modbus RTU (RS485), you can only have one client (gateway) on the bus and multiple servers (sensors). With Modbus TCP, you can have multiple clients and servers.
Modbus is configured by adding a Modbus node to the root node or to any group below it, and then adding IO nodes to the Modbus node.
The Response timeout parameter determines how long the Modbus client will wait
for a response from a device. The default is 100ms, which is adequate for most
devices, but it can be increased if you are communicating with a slow device.
Modbus IOs can be configured to support most common IO types and data formats:
The Scale and Offset parameters convert between the raw register value and
the value stored in the node: value = raw * scale + offset. A scale of zero is
treated as one, so an IO with no scale entered still reads its register.
Adding or removing an IO restarts the bus, which reopens the port. A Modbus server drops the connections it holds when this happens. This applies when a person edits the configuration, not during normal polling.
Schema
The configuration of an RTU client bus with one IO, and of a TCP server:
nodes:
  - modbus:
      baud: "9600"
      clientServer: client
      debug: 0
      description: Sensor bus
      disabled: 0
      pollPeriod: 500
      port: /dev/ttyUSB0
      protocol: RTU
      timeout: 100
      children:
        - modbusIo:
            address: 3
            dataFormat: uint16
            description: Tank level
            disabled: 0
            id: 1
            modbusIoType: modbusHoldingRegister
            offset: 0
            readOnly: 1
            scale: 0.1
            units: cm
  - modbus:
      clientServer: server
      description: PLC facing
      id: 5
      port: "502"
      protocol: TCP
      timeout: 100
clientServer is client or server and protocol is RTU or TCP. Which
of the remaining connection settings apply follows from those two: an RTU bus
uses port and baud, a TCP server uses port as the port it listens on, and
a TCP client uses uri, written as host:port. port and baud are text, so
both are quoted, including a TCP port number.
id is the Modbus device address rather than a node ID, which is why it is
spelled like any other point. A server carries it on the bus node, and a client
carries it on each IO, so one client bus can address several devices.
pollPeriod applies to a client and timeout to both, and both are in
milliseconds. A timeout of zero or less is replaced with 100.
modbusIoType is one of modbusDiscreteInput, modbusCoil,
modbusInputRegister, or modbusHoldingRegister. dataFormat is uint16,
int16, uint32, int32, or float32, and it applies to the register types
along with scale, offset, and units.
The values read and written, the error counts, and the connection state are points the client maintains, so an export of a running bus carries them as well.
Videos
Simple IoT Integration with PLC Using Modbus
Simple IoT upstream synchronization support
Simple IoT Modbus Demo
MQTT
Simple IoT can serve MQTT itself and turn published messages into points. See the PLC page for how MQTT compares with the other ways to bring plant data in, and ADR-8 for how common MQTT payload formats compare with the Simple IoT point model. The design is open for discussion on the community forum.
Support comes in four pieces, each usable on its own:
- A built-in broker. Gateways and sensors publish directly to Simple IoT, with no separate broker to deploy, secure, and update.
- Subscriptions. An
mqttnode and itsmqttSubchildren map named topics into points. - A topic schema. Declare what your topic levels mean, and nodes are created automatically as data arrives.
- Sparkplug B. Birth certificates describe the data, so the node structure builds itself. Covered in its own section below.
The built-in broker
Simple IoT embeds a NATS server, and NATS includes an MQTT server. It needs JetStream, which Simple IoT already runs, so serving MQTT is a port setting rather than a new dependency:
SIOT_NATS_MQTT_PORT=1883
The port is disabled by default. Points worth knowing:
- The broker implements MQTT 3.1.1. Clients that require MQTT 5 are refused, which matters mostly for newer gateways that default to version 5.
- QoS 0, 1, and 2 are supported. Sessions and retained messages are stored in JetStream, so they survive a restart.
- When an auth token is configured (
SIOT_AUTH_TOKEN), MQTT clients supply it in the password field of the connect packet, with any non-empty user name alongside it, which MQTT 3.1.1 requires whenever a password is present. Use TLS (SIOT_NATS_TLS_CERT/SIOT_NATS_TLS_KEY, which also serve the MQTT listener) whenever a connection leaves a trusted network. - Published messages become NATS subjects, so anything connected to Simple IoT
over NATS sees them. Topic levels convert as
/to., and a literal.in a topic converts to//. A Sparkplug topic ofspBv1.0/plant/DDATA/line3/tankarrives on the NATS subjectspBv1//0.plant.DDATA.line3.tank.
Add -u siot -P $SIOT_AUTH_TOKEN to both when a token is configured. The
command line walkthrough below
takes this further and creates nodes from published messages.
An external broker still makes sense when the plant already runs one, when you bridge several sites, or when you need broker features such as clustering or fine-grained access control. Connecting to an external broker as a client is planned as well, so the choice stays open.
Subscriptions
An mqtt node holds the connection, and each mqttSub child maps one topic
into points:
nodes:
  - mqtt:
      description: Plant data
      uri: "" # blank uses the built-in broker
      children:
        - mqttSub:
            description: Tank level
            topic: plant/line3/tank/level
            path: $.value
            units: cm
A blank uri uses the broker built into this instance, which is the only mode
available today – setting a uri reports an error on the node until external
brokers are supported. mqttSub settings:
| Setting | Purpose |
|---|---|
topic | The topic to subscribe to |
path | Where in a JSON payload the value lives, such as $.value |
units | Engineering units, carried on the emitted points |
scale | Multiplier applied to numeric values, 1 when unset |
offset | Added after scaling: value = raw * scale + offset |
disabled | Stops the subscription without deleting the configuration |
Each subscription also carries a tag point named topic holding the full topic,
so a series can be traced back to the message that produced it. See the
graphing section of the PLC page.
A payload that does not parse, or a path that is not in it, sets an error
point on the subscription node and leaves the rest running.
Payloads
Payloads are JSON, which covers the AWS IoT, Azure IoT, and gateway-defined
formats most installations use. How a payload maps depends on path:
pathset: the value at that location becomes a single point. Numbers becomevaluepoints, strings become text points, andtrueandfalsebecome 1 and 0 so a rule compares them the way it compares any other on/off value.pathblank, payload is a bare number or string: the payload itself becomes the point.pathblank, payload is an object: each top-level field becomes a point, with the field name as the point key. A payload with twenty fields becomes one node and twenty points rather than twenty nodes, and the field name is queryable in the database as thekeylabel.
A path is written in the dot notation JSON documentation generally uses:
$.value, $.a.b, and $.a[0] all work, and the leading $ is optional.
Topics you have not named are ignored. A wildcard topic on one mqttSub
subscribes fine, but every match lands on that one node, so name topics
individually when they represent different things. The topic schema below is the
better tool when you want one rule to cover many topics.
On an mqtt node that is not directly under the root, a topic filter (and a
topic schema) must start with a literal level: plant-07/# is allowed, and #,
+, and +/temp are refused with an error on the node. The broker is shared by
every group on the instance, so a node inside one group may not subscribe to
what every other group publishes. An mqtt node directly under the root may use
any filter.
Automatic nodes with a topic schema
Plain MQTT carries no information about which topic level is a site and which is
a device, which is why nothing is created automatically by default. A topic
schema supplies that missing information. Declare what the levels mean on the
mqtt node, and matching topics create nodes as data arrives:
nodes:
  - mqtt:
      description: Plant data
      uri: ""
      topicSchema: "{site}/{gateway}/{device}"
The first message on plant-07/kepware-l3/press/tank_level carrying
{"value": 42.1} creates:
Plant data (mqtt)
└── plant-07 (group, tag: site=plant-07)
    └── kepware-l3 (group, tag: gateway=kepware-l3)
        └── press (mqttDevice, tag: device=press)
              point: value, key tank_level
Expanding the mqttDevice node in the web UI lists every point it holds
alongside its current value, so you can see what a device is publishing without
querying the store.
The rules:
- Each named level becomes a node, carrying a tag named by its schema label.
Intermediate levels are group nodes; the last named level is an
mqttDevicenode that receives the points. Levels written without braces are literals a topic has to match, soplant/{site}/{device}covers one prefix only. - Everything beyond the named levels becomes the point key. Remaining topic
levels and JSON field names join into the key with
/, so a deeper topic extends the key rather than the node tree. A payload carrying a single field namedvalueis treated as a scalar, since that is the shape a gateway publishing one measurement per topic uses. - Nodes are matched by topic identity, not by name. Renaming a description or adding tags to an auto-created node survives later messages and restarts, and nothing is duplicated.
- Nodes are never deleted automatically. A quiet sensor and a removed sensor look the same from outside, so removal stays a human decision.
- A
maxNodeslimit (default 1000) guards against topics that carry unbounded values such as message IDs. When the limit is reached, an error point is set on themqttnode and new topics are dropped. The same limit bounds the groups, edge nodes, and devices Sparkplug creates, counted separately. - Explicit
mqttSubchildren win. A topic named by a subscription is handled by that subscription alone, so hand-tuned mappings with units and scaling override the schema where precision matters.
The schema and explicit subscriptions compose well: start with a schema to see
what a site publishes, then add mqttSub entries for the values that need
units, scaling, or careful naming.
Trying a topic schema from the command line
A topic schema is the quickest way to watch MQTT data turn into nodes, and the
Mosquitto command line tools are enough to exercise the whole path. Install them
with apt install mosquitto-clients, pacman -S mosquitto, or
brew install mosquitto, then start an instance with the broker enabled:
SIOT_NATS_MQTT_PORT=1883 siot serve
Add an mqtt node with a schema. Setting debug: 1 logs every message the node
handles, which is worth having while testing:
cat <<EOF | siot import
apiVersion: 1
nodes:
  - mqtt:
      description: Plant data
      uri: ""
      topicSchema: "{site}/{gateway}/{device}"
      debug: 1
EOF
One measurement per topic
Publishing a single value per topic is what most gateways do. The schema names three levels, so the first message creates the site, gateway, and device nodes, and the levels past the third become the point key:
mosquitto_pub -h localhost -p 1883 \
  -t plant-07/kepware-l3/press/tank_level -m '{"value":42.1}'
mosquitto_pub -h localhost -p 1883 \
  -t plant-07/kepware-l3/press/pump_rpm -m '{"value":1800}'
A payload that is a bare number or string works the same way, so a gateway that
publishes 1800 with no JSON around it needs nothing extra:
mosquitto_pub -h localhost -p 1883 -t plant-07/kepware-l3/pump/rpm -m 1800
Several measurements in one payload
A gateway that publishes an object at the device level, the last level the schema names, gets one point per field, with the field name as the point key:
mosquitto_pub -h localhost -p 1883 -t plant-07/kepware-l3/hmi \
  -m '{"line_speed":12.5,"state":"running","running":true}'
Numbers become value points, strings become text points, and true and false
become 1 and 0, so the hmi device ends up with line_speed, state, and
running.
Topic levels past the schema and field names inside the payload join into the
key with /, which means a deeper topic extends the key rather than the tree:
mosquitto_pub -h localhost -p 1883 \
  -t plant-07/kepware-l3/pump/motor/temp -m '{"value":38.5,"units":"C"}'
That message lands on the pump device as motor/temp/value and
motor/temp/units. An object holding one field named value is the scalar
case, so the same topic carrying {"value":38.5} produces the single key
motor/temp.
Seeing what arrived
siot export prints the tree the messages built, tags included:
$ siot export
apiVersion: 1
nodes:
  - mqtt:
      description: Plant data
      topicSchema: "{site}/{gateway}/{device}"
      children:
        - group:
            description: plant-07
            id: plant-07
            tag:
              site: plant-07
            children:
              - group:
                  description: kepware-l3
                  id: kepware-l3
                  tag:
                    gateway: kepware-l3
                  children:
                    - mqttDevice:
                        description: press
                        id: press
                        tag:
                          device: press
                        value:
                          pump_rpm: 1800
                          tank_level: 42.1
siot log prints points as they arrive, which answers whether a value is
updating without reloading a page:
$ siot log
2026/08/20 14:32:09 NODE: hmi (mqttDevice) (799dd5f3-aa51-4245-a31d-5f3139cca804)
   - POINT: T:value V:12.500 K:line_speed O:d931bb99-e924-4fc2-86e7-d949ec942f2c 2026-08-20T14:32:09-04:00
mosquitto_sub shows the messages themselves, which separates a gateway that is
not publishing from a schema that is not matching:
mosquitto_sub -h localhost -p 1883 -t 'plant-07/#' -v
The same nodes appear in the web UI at http://localhost:4223, where you can
rename a device or add tags to it. Those edits survive later messages and
restarts, since auto-created nodes are matched by their id point rather than
by description.
If nothing appears
- Match the depth. A schema of
{site}/{gateway}/{device}needs three levels, so a message onplant-07/kepware-l3is ignored and logs nothing, even withdebug: 1set. - Supply the token. When
SIOT_AUTH_TOKENis set, a client that connects without it is refused with return code 5. Add-u siot -P $SIOT_AUTH_TOKENto themosquitto_pubandmosquitto_subcommands; the user name can be anything non-empty, which MQTT 3.1.1 requires alongside a password. - Stay on MQTT 3.1.1. The Mosquitto clients use it by default, so no flag is
needed. Passing
-V mqttv5is refused by the broker. - Check the
mqttnode for an error point. A topic level carrying an unbounded value can reachmaxNodes(1000 by default), after which new topics are dropped and the error point says so. - Watch for typos becoming nodes. Nodes are never deleted automatically, so a mistyped topic leaves a node behind. Delete it in the UI once you are done.
Sparkplug B
Note, Sparkplug B support is preliminary, testing feedback is welcome.
Sparkplug B adds a defined topic namespace, a
protobuf payload, and birth and death certificates on top of MQTT. Because an
edge node announces every metric it will report, with names and types, Simple
IoT builds the node structure from the data itself and no schema or subscription
list is required. Enable it on the mqtt node:
nodes:
  - mqtt:
      description: Plant 03 Sparkplug
      uri: ""
      sparkplug: true
The topic namespace is spBv1.0/{group}/{message type}/{edge node}/{device},
and it maps onto the graph directly:
Plant 03 Sparkplug (mqtt)
└── plant-03 (sparkplugGroup)
    └── ignition-edge (sparkplugNode)
        ├── press-1 (sparkplugDevice)
        │     points: tank_level, pump_rpm, ...
        └── press-2 (sparkplugDevice)
- NBIRTH and DBIRTH create or refresh the group, edge node, and device nodes and write one point per metric. A birth after a gateway restart refreshes the existing nodes rather than duplicating them, and tags or descriptions you have set on them survive.
- NDATA and DDATA arrive as point updates carrying the payload timestamp. Metrics are referenced by numeric alias after birth, and the alias assignments are kept on the edge node, so data that arrives after a restart resolves straight away. When there is no mapping for an alias – data from a gateway that was already running when Simple IoT started, for instance – Simple IoT requests a rebirth and the structure builds itself from the answer.
- NDEATH and DDEATH mark the node offline rather than deleting it. An edge node death takes its devices offline with it.
Each auto-created node carries a tag naming its Sparkplug identity –
sparkplugGroup, sparkplugNode, sparkplugDevice – so queries select on the
structure the same way they select on a hand-set tag, and
tag inheritance carries a site tag on the mqtt node down
through all of it.
Metric names become point keys, with any character a subject cannot carry replaced by an underscore. Sparkplug types map to point types the same way other PLC values do: see the data types table. Metrics carrying a dataset, a template, or a file are skipped for now, and the rest of the message is used. Acting as a Sparkplug primary host application (the STATE topic) and publishing Simple IoT data outbound as Sparkplug are not part of this support.
A multi-site deployment
Fifteen sites, each with one or more gateways publishing JSON to the broker built into a central instance. Put identity in the topic and configure the gateways to match:
{site}/{gateway}/{device}/{measurement}
With one mqtt node and a topic schema, the whole fleet needs no per-site
configuration; sites, gateways, and devices appear as they publish, each
carrying its tags:
apiVersion: 1
nodes:
  - mqtt:
      description: Plant data
      uri: ""
      topicSchema: "{site}/{gateway}/{device}"
When a site needs curated metadata, give it a provisioning file instead, with a
group node per site carrying a site tag and explicit mqttSub entries below
it:
apiVersion: 1
nodes:
  - group:
      description: Plant 07
      tag:
        site: plant-07
      children:
        - mqtt:
            description: Kepware line 3
            uri: ""
            tag:
              gateway: kepware-l3
            children:
              - mqttSub:
                  description: Tank level
                  topic: plant-07/kepware-l3/press/tank_level
                  path: $.value
                  units: cm
                  tag:
                    machine: press-3
The two compose: start with the schema to see what fifteen sites are publishing,
then add mqttSub entries, which take precedence, for the values that need
units, scaling, or careful naming.
With tag listed in the Database node’s Tag Point Types,
every point arrives in the time series database labeled by site, gateway, and
machine:
points_value{key="tank_level",
             "node.tag.site"="plant-07",
             "node.tag.gateway"="kepware-l3",
             "node.tag.machine"="press-3"}
A Sparkplug site is one more node with sparkplug: true under its site group,
and its auto-created structure inherits the same site tag. The
graphing section of the PLC page covers how topic
hierarchies, tags, and point keys become queryable series, and the cautions that
come with them: keep unbounded values out of tags, and settle names before
collecting history you intend to keep.
Not yet planned in detail
- External brokers. The
urisetting is reserved for connecting to an existing broker as a client. - Schema-less discovery, for browsing what an unfamiliar broker publishes under a prefix when no topic convention exists.
- Per-client credentials, so each gateway authenticates individually and can be restricted to its own topics. The device credential authorizer already covers the MQTT listener; what remains is a credential type scoped to topics rather than to a device’s sync subjects.
- MQTT 5, which depends on the NATS server gaining support for it.
1-Wire
(note, this client has been refactored, but not tested. Testing is welcome …)
1-Wire is a device communication bus that provides low-speed data over a single conductor. It is also possible to power some devices over the data signal as well, but often a third wire is run for power.
Simple IoT supports 1-wire buses controlled by the
1-wire (w1) subsystem
in the Linux kernel.
To use a bus, add a 1-Wire node where you want it in the tree and set its
Index to the number of the bus controller, which matches the
w1_bus_master<index> directory the kernel creates in /sys/bus/w1/devices.
The first controller is index 0. Simple IoT then detects the sensors on that bus
and creates a node for each one.
Bus Controllers
Raspberry PI GPIO
There are a number of bus controllers available but one of the simplest is a
GPIO on a Raspberry PI. To enable, add the following to the /boot/config.txt
file:
dtoverlay=w1-gpio
This enables a 1-wire bus on GPIO 4.
To add a bus to a different pin:
dtoverlay=w1-gpio,gpiopin=x
A 4.7kΩ pull-up resistor is needed between the 1-wire signal and 3.3V. This can be wired to a 0.1 inch connector as shown in the following schematic:
See this page for more information.
1-Wire devices
DS18B20 Temperature sensors
Simple IoT currently supports 1-wire temperature sensors such as the DS18B20.
This is a very popular and practical digital temperature sensor. Each sensor has
a unique address so you can address a number of them using a single 1-wire port.
These devices are readily available at low cost from a number of places
including eBay - search for DS18B20, and look for an image like the below:
Readings are in degrees Celsius by default. Set Units on a device node to F
to report degrees Fahrenheit instead.
Schema
The configuration of a 1-wire bus and one of its devices:
nodes:
  - oneWire:
      debug: 0
      description: Tank sensors
      disabled: 0
      index: 0
      pollPeriod: 3000
      children:
        - oneWireIO:
            description: Tank top
            disabled: 0
            id: 28-0000073b6f4d
            units: F
index is the number of the bus controller, matching the w1_bus_master<index>
directory in /sys/bus/w1/devices. pollPeriod is in milliseconds and defaults
to 3000 when it is zero or missing.
id on a device is its 1-wire address rather than a node ID, which is why it is
spelled like any other point. Simple IoT creates a device node for each sensor
it detects on the bus, so these usually arrive on their own; what a file adds is
a lasting description and, where wanted, units.
Leaving units out reports degrees Celsius. The readings and error counts are
points the client maintains, so an export of a running bus carries them as well.
Messaging Services
SIOT supports multiple messaging services. Add a Messaging Service node, select the service, and fill in the fields for that service. Where the node sits in the tree decides which messages it processes, as described in the notifications documentation, so a service that serves a whole company belongs on the company group rather than on any one device.
Delivery failures are reported on the node’s error point and shown in the UI.
Twilio and email messages go to the phone number or email on the user node that raised the message, so adding a user with a phone or email is how a recipient is added. Each service sends at most 30 messages at once and then one more every 30 seconds; a message over that limit is dropped and reported on the error point.
Twilio SMS
Simple IoT supports sending SMS messages using Twilio’s
SMS service. sid and authToken are
the Twilio account SID and auth token, and from is the number messages are
sent from.
Email (SMTP)
The smtp service sends each user’s message as an email. url is the SMTP
server as host:port (typically port 587), from is the sender address, and
username/authToken are the login credentials — leave both empty for a server
that accepts unauthenticated mail. STARTTLS is used automatically when the
server offers it.
ntfy Push Notifications
The ntfy service publishes notifications to an ntfy topic,
which delivers push notifications to the ntfy phone and desktop apps and
anything else subscribed to the topic. Unlike Twilio and email, ntfy needs no
user nodes: every notification raised in the service’s scope is published to the
topic. url is the ntfy server (leave empty for the public https://ntfy.sh),
topic is the topic name, and authToken is an optional access token for
protected topics.
Schema
Below is an export of one node per service:
nodes:
  - msgService:
      description: Twilio SMS
      service: twilio
      sid: ACxxxxxxxxxxxxxxxxxxxxxxxxxxxxxxxx
      authToken: your-twilio-auth-token
      from: "+12155551212"
  - msgService:
      description: Company email
      service: smtp
      url: smtp.example.com:587
      username: alerts@example.com
      authToken: your-smtp-password
      from: alerts@example.com
  - msgService:
      description: Ops push channel
      service: ntfy
      topic: xyz-plant-alerts
from is written as text so a leading + is kept.
An export carries authToken as it was entered, so treat a file that contains
messaging service nodes the way you would treat the credentials themselves.
MCU Devices
Microcontroller (MCU) devices can be connected to Simple IoT systems via various serial transports (RS232, RS485, CAN, and USB Serial). The Arduino platform is one example of an MCU platform that is easy to use and program. Simple IoT provides a serial interface module that can be used to interface with these systems. The combination of a laptop or a Raspberry PI makes a useful lab device for monitoring analog and digital signals. Data can be logged to InfluxDB and viewed in the InfluxDB Web UI or Grafana. This concept can be scaled into products where you might have a Linux MPU handling data/connectivity and a MCU doing real-time control.
See the Serial reference documentation for more technical details on this client.
File Download
Files (or larger chunks of data) can be downloaded to the MCU by adding a File node to the serial node. Any child File node will then show up as a download option.
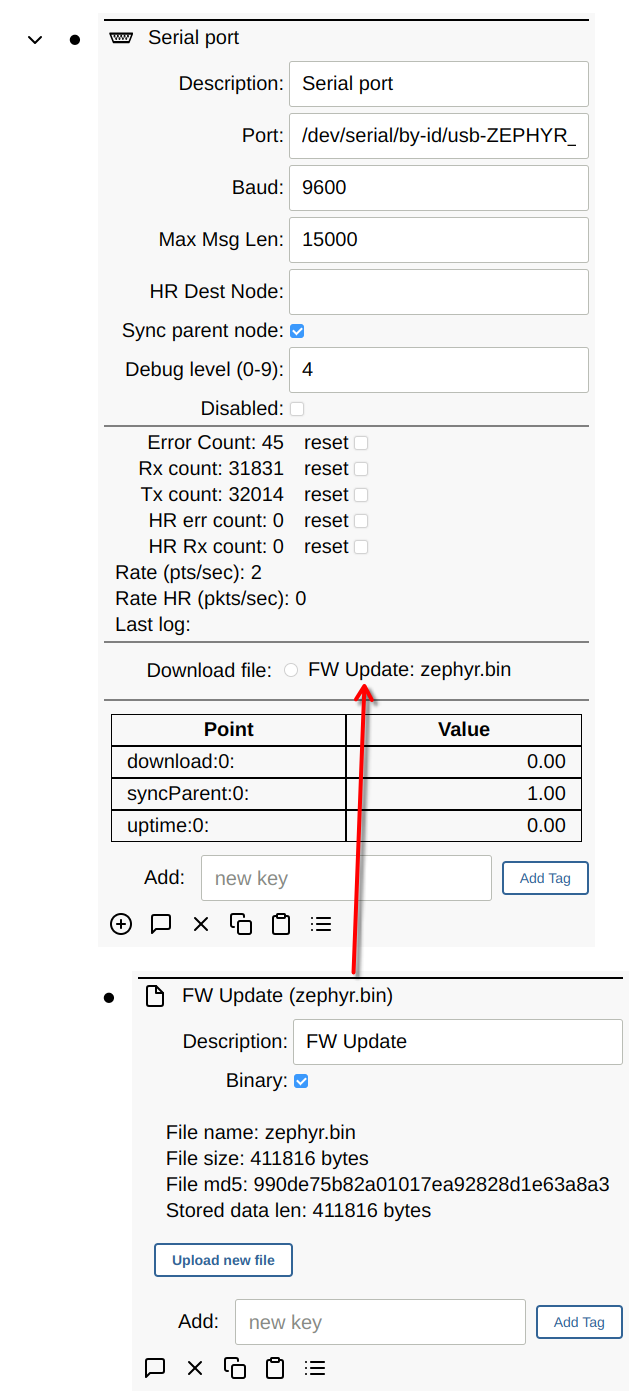
Protocols
The serial client speaks two wire protocols, selected with the Protocol setting on the node.
Binary is the default and is what existing nodes use. Points are exchanged as COBS-framed packets with a sequence number and a CRC. It is compact, and it supports high-rate data and file transfer. See the Serial reference documentation for the packet format.
Zephyr shell exchanges points as lines of ASCII over an MCU’s console shell. Everything on the wire is readable, so the same link you use for debugging is the link Simple IoT uses for data. Choose this when your firmware already has a Zephyr shell, or when bringing up a new board where being able to see and type on the link matters more than efficiency.
An empty Protocol value means binary, so nodes created before shell mode existed keep working unchanged.
Shell protocol
The MCU emits each point as a line, and Simple IoT writes points back using the
p command the Zephyr firmware already registers:
pt uptime 0 INT 3600                              MCU to Simple IoT
p description 0 STR "lab bench" 2026-07-31T12:00:00.000000000Z
Both directions use the same fields and differ only in the verb, so an emitted line becomes a replayable command by changing one character. The verbs differ deliberately: Simple IoT must never mistake an echoed command for a point report.
Anything on the console that is not a point line is tolerated. Zephyr log
messages become log points, and the boot banner, shell prompt, and command
output are ignored rather than counted as errors.
High-rate data, file transfer, and packet acknowledgement are not available in shell mode, and the UI hides those controls when it is selected. Nodes that need them should stay on the binary protocol.
Timeout is how many seconds the link may be silent before the node is marked not connected, defaulting to 60. An open serial port says nothing about whether anything is alive on the other end, particularly on a USB port that survives an MCU reset.
Log Console Output
Log console output mirrors every line the MCU prints to the Simple IoT server log, tagged with the node description. Shell protocol only.
Once Simple IoT holds the serial port nothing else can read it, so this is what keeps the board observable. It works headless, lands in the journal when Simple IoT runs under systemd, and lets you watch a board boot in the terminal you started the server in. With it on, a separate terminal program is only needed before a node is attached to the port at all.
It is deliberately not a debug level: watching a board boot and diagnosing why a point is not arriving are different questions, and a single verbosity dial would force one to imply the other. Expect it to be loud on a board with network logging enabled.
Debug Levels
You can set the following debug levels to log information.
Binary protocol:
- 0: no debug information
- 1: log ASCII strings (must be COBS wrapped) (typically used for debugging code on the MCU)
- 4: log points received or sent to the MCU
- 8: log cobs decoded data (must be COBS wrapped)
- 9: log raw serial data received (pre-COBS)
Shell protocol:
- 0: no debug information
- 2: log malformed point lines, oversize lines, and warnings about points the MCU will truncate
- 4: log points decoded and each
pcommand written to the MCU - 9: log raw serial data received, before line assembly
Level 1 has no shell-mode meaning; console output is the separate checkbox described above, so the two can be used independently.
Schema
The configuration of a serial node using the shell protocol, with a file node available for download to the MCU:
nodes:
  - serialDev:
      baud: "115200"
      debug: 0
      description: Lab bench
      disabled: 0
      logConsole: 1
      maxMessageLength: 1024
      port: /dev/ttyACM0
      protocol: shell
      syncParent: 0
      timeout: 60
      children:
        - file:
            binary: 1
            data: SGVsbG8sIE1DVQ==
            description: Calibration table
            name: cal.bin
port and baud are text, so both are quoted. protocol is binary or
shell, and an empty value means binary, so nodes created before shell mode
existed carry no protocol point at all.
timeout is in seconds and maxMessageLength in bytes. logConsole applies to
the shell protocol alone.
The counts, the connection state, the uptime, and the log line shown in the UI are points the client maintains, so an export of a running node carries them as well.
A node sending high rate data also carries an hrDest point holding the ID of
the destination node. Unlike a point of type nodeID, it is written as the ID
rather than as a description, so it names a node in the instance it was exported
from. The destination has to be the serial node’s parent or a node below it; a
destination elsewhere in the tree is refused, high rate data is dropped until it
is fixed, and the reason is recorded as an error point on the serial node.
Zephyr Examples
The zephyr-siot repository contains examples of MCU firmware that can interface with Simple IoT over serial, USB, and Network connections. This is a work in progress and is not complete.
Arduino Examples (no longer maintained)
Several Arduino examples are available that can be used to demonstrate this functionality.
Metrics
An important part of maintaining healthy systems is to monitor metrics for the application and system. SIOT can collect metrics for:
- the system
- the SIOT application
- any named processes
For the named process, if there are multiple processes of the same name, then we add values for all processes found.
System Metrics
Thermal Metrics
On Linux systems, the system metrics also include the thermal state of the board:
- Temperature comes from the hwmon sensors and from the thermal zones in
/sys/class/thermal. Both are read because many SoCs expose their board sensors through hwmon while reporting the CPU, SoC, and junction temperatures through the zones alone. On a Jetson AGX Orin, for example,tj-thermalis the junction reading that governs throttling. - Fan RPM and PWM come from the hwmon fan and pwm attributes. PWM is the raw kernel value, which runs from 0 to 255.
- Cooling State is the current state of each entry in
/sys/class/thermal/cooling_device*, keyed by device type. Any value above zero means the thermal governor is limiting the system: acpufreqordevfreqdevice reports how far the clocks have been pulled back, and a fan reports how hard it has been asked to run. Temperature tells you how warm a board is, while the cooling state tells you whether that warmth is costing performance, so the two are worth reading together. Cooling State Max gives the scale each device is measured against and is collected once at startup.
Power and Clocks
Two more readings round out the picture of how hard a board is working:
- Voltage, Current, and Power come from the hwmon power monitors, such as
the INA3221 devices on a Jetson, and are published in volts, amps, and watts.
A channel is published when its driver labels it, which is how a board names
the rail that channel measures, so the points arrive keyed by rail name:
VDD_GPU_SOC,VIN_SYS_5V0, and so on. Monitors that do not report power themselves still report voltage and current, and the product stands in for the missing reading. - CPU MHz is the current clock of each core, keyed by
cpu0,cpu1, and so on. Cores that are offline are left out. This is the reading that completes the thermal story: temperature says how warm the board is, cooling state says the governor stepped in, and the clock says what that cost.
Every reading above is taken on its own, so one that is unavailable, which
happens when a rail is powered down or a monitor channel is disabled, does not
affect the rest. Sensor names are not guaranteed to be unique; repeated names
are numbered, as in tmp451 and tmp451_2.
SIOT Application Metrics
Named Process Metrics
Prometheus Metrics
A metrics node can also collect from an application that exposes a /metrics
endpoint in the Prometheus exposition format. Any Go service built with
client_golang has one, as do node_exporter, cAdvisor, and a great deal of
other infrastructure.
The usual way to collect these is to run Prometheus or vmagent and have it
scrape each target, which means the scraper needs network reach to every
machine. For a small number of custom servers that is more work than it is
worth, and exposing /metrics to the internet describes an application’s
internals to anyone who asks.
Because SIOT is already on the machine, it can scrape 127.0.0.1. The
application binds its endpoint to loopback and never listens on a public
interface, no port is opened, and the readings travel out over the connection
SIOT already holds. From there they reach rules, sync, and the
database client the same way any other point does.
Set the metrics type to prometheus and give the node a URI. One node per endpoint, so several applications on a machine means several nodes.
How samples become points
A metric name becomes the point type, and its labels become the point key,
rendered as name=value pairs joined by commas and sorted by label name. The
sort means a series keeps the same key from one scrape to the next no matter
what order the endpoint lists its labels in.
| Sample | Point type | Point key |
|---|---|---|
myapp_requests_total{method="post",code="200"} | myapp_requests_total | code=200,method=post |
myapp_queue_depth | myapp_queue_depth | (empty) |
myapp_seconds_bucket{le="0.005"} | myapp_seconds_bucket | le=0_005 |
A metric name needs no adjustment, since the characters Prometheus allows in one are all valid in a point type. Label values are ordinary text and often carry characters a point key cannot hold, most commonly the period in a histogram bucket boundary or a summary quantile, so those are replaced with underscores. Two values that differ only in such a character resolve to the same key, and the later sample wins; a label whose values differ only in punctuation is worth avoiding for that reason.
Histograms and summaries need no special handling. The exposition format has
already flattened them into ordinary samples by the time SIOT reads them, so
_bucket, _sum, and _count arrive as their own point types.
Counters
A counter only ever climbs, which makes it awkward to read in the UI and
unusable in a rule: “alert when errors increase” needs a rate, not a total. So a
counter publishes a second point under its own name with _delta appended,
carrying the change since the previous scrape. Nothing is published on the first
scrape of a series, since there is no earlier value to compare against. If a
counter decreases, the application restarted, and the delta is the current
value.
The raw counter is published as well, because that is what a time-series
database needs to compute rate() over. Turn the delta off with the Counter
deltas setting if the raw value is all you use.
Only a metric the endpoint declares a counter produces a delta. The _bucket,
_sum, and _count series of a histogram climb the same way but are left
alone, since a histogram with a dozen buckets would otherwise double a large
number of series.
Filtering and limits
Two settings keep a node to a sensible size:
- Metric Prefixes collects only metrics whose name starts with one of the
entries listed. Applications normally namespace their metrics, so
myapp_keeps an application’s own readings and leaves out thego_andpromhttp_series that anyclient_golangregistry adds. Press Add Prefix for each one you want; a metric is collected when it matches any of them, so a couple of subsystems from a larger exporter can be collected on one node. An empty list collects everything. - Max series bounds a single scrape, defaulting to 200 and capped at 3000. A scrape that exceeds the limit is sorted, truncated, and reported through the node’s error point, so a truncated scrape is visible rather than silent.
The limit matters because points live on the node, are stored, and replicate
upstream. An application’s own metrics usually number in the dozens, while
node_exporter and cAdvisor run to hundreds or thousands; collect those with a
prefix or a larger limit chosen deliberately.
The 3000 ceiling is a hard one, and a larger value is reported on the node rather than honored. A node request encodes a node and all of its points into a single NATS message, and a scraped point takes roughly 100 bytes, so 10,000 of them reach the 1 MB payload limit. Past that the store cannot answer the request at all, and because a reply carries a subtree rather than one node, every tree fetch covering the node fails and the UI stops loading. Three thousand points come to about 350 KB, which leaves room for the rest of the reply.
An endpoint too large for one node is better split across several, each with its own prefix. Nodes are inexpensive, and a failed scrape or a truncation then affects only the part of the endpoint it belongs to. The limit is a property of the store rather than of scraping; see Message and payload limits.
A scrape that fails, whether the endpoint is refusing connections, timing out, or answering with an error, publishes no readings and sets the node’s error point. Stale values are worse than absent ones. The error clears on the next successful scrape.
Reserved names
A metric whose name matches one of the node’s own settings cannot be published
under that name, because doing so would overwrite the setting. Such a metric
gets an underscore appended instead, so period is published as period_ and
the reading is kept. The rename is logged once per name. If the endpoint already
serves the renamed name, another underscore is added, so two metrics never land
on the same point.
The names that are renamed are description, type, name, period, uri,
prefix, counterDelta, maxSeries, tag, disabled, error, errorCount,
errorCountReset, connected, debug, log, and nodeType.
Prometheus convention is to namespace and unit-suffix a metric name, so a collision means the metric is worth renaming at the source. Doing that is better than relying on the underscore, since a query then names the metric the way the application does.
Querying scraped metrics
Points reach VictoriaMetrics as the metric points_value, tagged with the point
type and key along with the node tags described in the
database documentation. The Database client expands a key that
was written as a label set into individual labels, so a scraped series queries
the way the Prometheus series it came from did:
sum by (method) (points_value{type="myapp_requests_total_delta"})
and a histogram works with the bucket boundaries restored to numbers:
histogram_quantile(0.95,
  sum by (le) (points_value{type="myapp_request_duration_seconds_bucket"}))
This expansion is the Expand Key Labels setting on the Database node, which
is on by default. With it off, the labels are still reachable through the key
tag, though every query then carries its own extraction:
sum by (method) (
  label_replace(points_value{type="myapp_requests_total_delta"},
                "method", "$1", "key", ".*method=([^,]+).*")
)
Schema
The configuration of a system metrics node and a named process node:
nodes:
  - metrics:
      description: System
      period: 10
      tag:
        machine: press-1
      type: system
  - metrics:
      description: NATS server
      name: nats-server
      period: 10
      type: process
  - metrics:
      counterDelta: true
      description: My App
      maxSeries: 200
      period: 30
      prefix:
        - myapp_
        - worker_
      type: prometheus
      uri: http://127.0.0.1:9100/metrics
type is system, app, process, or prometheus, and period is how often
readings are taken, in seconds. name is the process name to watch and applies
to a process node; values for all processes of that name are added together.
uri, prefix, counterDelta, and maxSeries apply to a prometheus node.
uri is the endpoint to scrape, counterDelta publishes the change in each
counter alongside its raw value, and maxSeries bounds how many readings one
scrape publishes, defaulting to 200 and capped at 3000.
prefix collects only metrics whose name starts with one of its entries. It is
a list, so a single prefix is written as one value and several are written as a
sequence, as above. A metric is collected when it matches any entry, and a
prefix left out collects everything.
tag is a set of keyed points, and each one becomes a label on the samples the
database client writes when its point type is listed there.
The readings themselves are points on the same node, so an export of a running instance carries them alongside the settings above.
Particle.io
SIOT provides a client for pulling data from Particle.io. Particle provide modules to quickly implement cellular connected MCU based IoT systems. They take care of managing the device (cellular connection, firmware deployments, etc.), and you only need to write the application.
The Particle cloud event API is used to obtain the data. A connection is made from the SIOT instance to the Particle Cloud and then data is sent back to SIOT using Server Sent Events (SSE). The advantage of this mechanism is that complex webhooks are not needed on the SIOT side, which requires additional firewall/web server configuration.
A Particle API key is needed which can be generated using the particle token
CLI command.
The above example shows data provided by the Particle based Simple IoT Particle Gateway and 1-wire temperature sensors, and SIOT firmware.
Data is published to Particle in the following format:
[
	{
		"id": "4B03089794485728",
		"type": "temp",
		"value": 15.25
	}
]
The SIOT Particle client populates the point key field with the 1-wire device
ID.
Schema
The configuration of a Particle node:
nodes:
  - particle:
      authToken: your-particle-token
      description: Particle Cloud
      disabled: 0
authToken is the token generated by particle token. An export carries it as
it was entered, so treat a file that contains Particle nodes the way you would
treat the token itself.
The data from the cloud arrives as points on this same node, one point per reading with the device ID as the point key, so an export of a running node carries those as well.
Rules
Contents
The Simple IoT application has the ability to run rules - see the video below for a demo:
Rules are composed of one or more conditions and actions. All conditions must be true for the rule to be active.
Node point changes cause rules of any parent node in the tree to be run. This allows general rules to be written higher in the tree that are common for all device nodes (for instance device offline).
In the below configuration, a change in the SBC propagates up the node tree,
thus both the D5 on rule or the Device offline rule are eligible to be run.
Node linking
Both conditions and actions can be linked to a node ID. If you copy a node, its ID is stored in a virtual clipboard and displayed at the top of the screen. You can then paste this node ID into the Node ID field in a condition or action.
Conditions
Each condition may optionally specify a minimum active duration (minActive),
in minutes, that it has to hold continuously before it is considered met. This
is a pending period, and it keeps a brief spike — a level that grazes a
threshold, a device that drops offline for a few seconds — from activating the
rule at all. An input that crosses the threshold and returns before the period
expires never activates the condition, and the wait starts over the next time it
crosses.
A condition may also specify a minimum inactive duration (minInactive), the
mirror image of minActive: once the condition is met, it stays met until its
input has been clear for that many minutes. An input that returns before the
duration expires cancels the wait and the condition never goes inactive, so a
value oscillating around a threshold is one incident and one notification rather
than one per cycle.
Both durations are in-process state, so they restart if the instance restarts or the rule is edited. Disabling a rule clears them as well.
Together with the repeat interval on a notify action, these durations follow the model Grafana alerting and Prometheus Alertmanager have converged on, because they address the same problems: noisy conditions, flapping, and notification fatigue. Two of Grafana’s defenses are handled elsewhere in Simple IoT rather than in the rule. Evaluating over an aggregation window instead of raw samples belongs in the client producing the point, and a recovery threshold separate from the firing threshold is done with two rules or an inactive action as described in Set node point.
Node state
A point value condition looks at the point value of a node to determine if a condition is met. Qualifiers that filter points the condition is interested in can set including:
- Node ID (if left blank, any node that is a descendant of the rule parent)
- Point type (“value” is probably the most common type)
- Point Key (used to index into point arrays and objects)
If the provided qualification is met, then the condition may check the point value/text fields for a number of conditions including:
- number:
>,<,=,!= - text:
=,!=,contains - boolean:
on,off
Schedule
Rule conditions can be driven by a schedule that is composed of:
- start/stop time
- weekdays
- dates
If no weekdays are selected, then all weekdays are included.
When the dates are used, then weekdays are disabled.
Conversely, when a weekday is enabled, dates are disabled.
As a time range can span two days, the start time is used to qualify weekdays and dates.
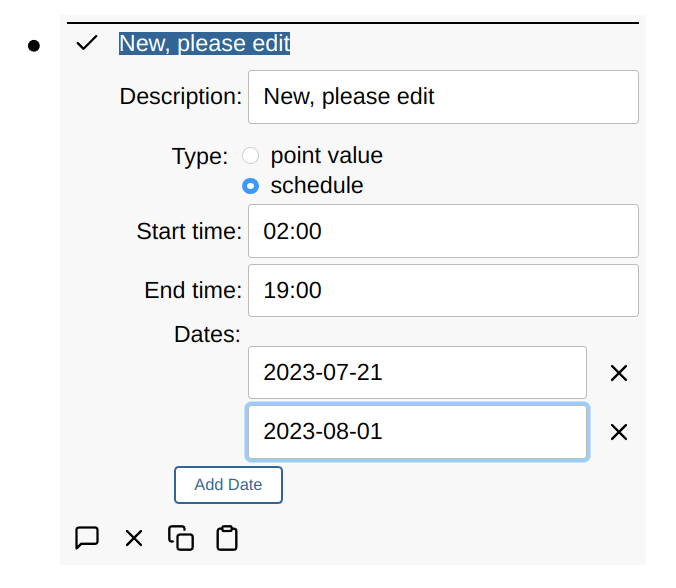
See also a video demo:
Actions
Actions run when the rule changes state. Actions of type action run on the
inactive to active transition, and actions of type actionInactive run on the
active to inactive transition. Editing a rule, a condition, or an action while
the rule is active does not re-run the actions — only a change of state does.
Disabling a rule makes it inactive, which is a transition like any other, so disabling an active rule runs its inactive actions once and further edits while it stays disabled run nothing.
Rule state is persisted, so a restart resumes in the state the rule was in and does not re-run the actions or re-send the notification for a state that has not changed.
Notifications
A notify action publishes a notification point on the rule node each time the rule goes active (or inactive, for an inactive action). The notification carries the rule description as the subject and names the node that triggered the rule in the message. From there it is delivered to users and messaging services in scope as described in the notifications documentation.
Each state transition sends one notification. A notify action may also set a repeat interval, in minutes, which turns on two behaviors at once:
- A reminder. While the rule stays active, an action of type
actionre-sends its notification every interval, so a long running condition is not a single message that scrolled away hours ago. An inactive action does not repeat — a resolved rule is the normal state, so a reminder about it would never stop. - A rate limit. An action does not notify more often than its repeat
interval no matter how often the rule transitions. The transition still
happens and the rule state is still correct; only the notification is dropped.
This bounds the damage from a condition that flaps faster than its
minActiveandminInactivedurations guard against.
With no repeat interval set, an action sends one notification per transition and is not rate limited. Send times are in-process state, so they reset if the instance restarts.
Set node point
Rules can also set points in other nodes. For simplicity, the node ID must be currently specified along with point parameters and a number/bool/text value.
The target has to be the rule’s parent or a node below it. An action that names a node elsewhere in the tree is refused, and the reason is shown as an error on the action. A rule that needs to reach across groups belongs at a level that contains both.
Typically a rule action is only used to set one value. In the case of on/off actions, one rule is used to turn a value on, and another rule is used to turn the same value off. This allows for hysteresis and more complex logic than in one rule handled both the on and off states. This also allows the rules logic to be stateful. If you don’t need hysteresis or complex state, the rule “inactive action” can be used, which allows the rule to take action when it goes both active and inactive.
Disable Rule/Condition/Action
Disable Rule
A rule can be disabled. If the rule is disabled while active, then the rule inactive actions are run so that things get cleaned up if necessary and the actions are not left active.
Disable Condition
If there are no conditions, or all conditions are disabled, the rule is inactive. Otherwise, disabled conditions are simply ignored. For example, if there is a disabled condition and a non-disabled active condition, the rule is active.
Disable Action
A disabled action is not run.
Schema
The configuration of a rule with a point value condition, a schedule condition, and an action for each direction:
nodes:
  - rule:
      description: Tank low
      disabled: 0
      children:
        - condition:
            conditionType: pointValue
            description: Level below 10
            disabled: 0
            minActive: 5
            minInactive: 10
            nodeID: Tank level
            operator: <
            pointKey: ""
            pointType: value
            value: 10
            valueType: number
        - condition:
            conditionType: schedule
            description: Working hours
            end: "17:00"
            start: "08:00"
            weekday:
              - 0
              - 1
              - 1
              - 1
              - 1
              - 1
              - 0
        - action:
            action: notify
            description: Tell the operators
            repeatInterval: 240
        - actionInactive:
            action: setValue
            description: Clear the alarm
            nodeID: Alarm relay
            pointType: switchSet
            value: 0
            valueType: onOff
Conditions and actions are children of the rule, and an inactive action is a
child of type actionInactive, which is what lets one rule act in both
directions.
nodeID names the node a condition watches or an action writes to, and it is
written as that node’s description rather than as an ID, so a rule can be moved
between instances. Leaving it out of a condition watches every node below the
rule’s parent. See
referring to another node for how
the name is resolved.
conditionType is pointValue or schedule. A point value condition qualifies
the points it is interested in with pointType and pointKey, and valueType
decides how it compares them: a number condition compares value using
operator, one of >, <, =, or !=; a text condition compares
valueText using =, !=, or contains; and an onOff condition matches a
value of 1 or 0 and needs no operator. minActive is how many minutes the
condition has to hold before it is considered met, and minInactive is how many
minutes its input has to be clear before it stops being met.
A schedule condition uses start and end, written as text so 08:00 keeps
its leading zero, along with weekday and date. weekday is seven points,
Sunday first, each 1 or 0. date is a list of dates, and a schedule carries
dates or weekdays rather than both.
action is notify, setValue, or playAudio. A notify action takes an
optional repeatInterval, in minutes, which reminds while the rule stays active
and rate limits the action in both directions. A setValue action names what to
write with nodeID, pointType, and pointKey, and what to write with
valueType and value or valueText. A playAudio action names the WAV file
to play with filePath (an absolute path, or a file name with no directory),
the ALSA device to play it on with device, and the channel with channel.
The rule’s active state, its most recent notification, and any error are
points the client maintains, so an export of a running rule carries them as
well.
Shelly IoT
Shelly sells a number of reasonably priced open IoT devices for home automation and industrial control. Most support Wi-Fi network connections and some of the Industrial line also supports Ethernet. The API is open and the devices support a number of communication protocols including HTTP, MQTT, CoAP, etc. They also support mDNS so they can be discovered on the network.
Simple IoT provides the following support:
- Automatic discovery of all Shelly devices on the network using mDNS
- Support for any Gen2 or later device, including ones released after this was written. A device reports its own components, so what Simple IoT reads from it follows from what it has rather than from a list of models.
- Support for Gen1 devices through their HTTP API
- Status arrives by push on Gen2 and later, over a WebSocket the device sends updates on as they happen. Gen1 devices are polled every 2 seconds.
How a device is read
A Gen2 or later device answers Shelly.GetStatus with its whole state, keyed by
component: switch:0, input:1, cover:0, em:0, temperature:100. Simple
IoT reads that list and creates one point per component, keyed by the component
id. A device with two relays reports two switches; an add-on module contributing
a temperature sensor reports it alongside the rest.
Measurements follow the same rule. A switch that reports apower, voltage,
and current has power monitoring, so those points appear; a switch without it
reports none of them and none appear. Nothing in Simple IoT records which models
measure power.
Simple IoT keeps a WebSocket open to each Gen2 or later device. Once connected, the device pushes each change as it happens, so a relay switched at the wall shows up right away rather than at the next poll. Simple IoT still reads the whole device once a minute as a backstop, and treats loss of the connection as the device going offline.
The following point types can appear, depending on the device: switch,
light, input, position, coverState, power, voltage, current,
energy, powerFactor, apparentPower, frequency, temp, humidity,
brightness, white, lightTemp, battery, batteryLevel, externalPower,
and alarm.
Setup
- Configure the Shelly devices to connect to your Wi-Fi network. There are
several options:
- Use the Shelly phone app
- A new device will start up in access point mode. Attach a computer or phone to this AP, open http://192.168.33.1 (default address of a reset device), and then configure the Wi-Fi credentials using the built-in Web UI.
- Add the Shelly client in SIOT
- The Shelly client will then periodically scan for new devices and add them as child nodes.
Example
Plug Example
Schema
The configuration of a Shelly node and one of the devices it found:
nodes:
  - shelly:
      description: Shelly
      disabled: 0
      children:
        - shellyIo:
            controlled: 1
            description: Bench light
            deviceID: B0B21C12AD58
            disabled: 0
            gen: 2
            ip: 192.168.1.42
            type: SNPL-00116US
The Shelly node itself only carries a description and whether it is disabled.
Everything else follows from what it finds: the client scans the network and
adds a child node for each device, filling in deviceID, ip, gen, and
type itself. type is the model the device reports for itself, such as
SNPL-00116US for a Plus Plug US or SHPLG-S for a Gen1 Plug S. ip must be
an IP address. A device that answers a scan from a new address is moved there
only when the device at that address reports the MAC in deviceID, since an
mDNS answer on its own is not proof of which device sent it.
What you configure on a device is its description, whether it is disabled,
and, for a device that can be driven, controlled. With controlled set, the
client drives the device to the switchSet, lightSet, and positionSet
values whenever they differ from what the device reports, which is what lets a
rule or the UI change its state.
The readings and states, along with whether the device is currently reachable,
are points the client maintains, so an export of a running node carries them as
well. A device with more than one channel carries one point per channel, keyed
by the component id the device uses. Those ids are not always a dense range: an
add-on module numbers its components from 100, so a Plus 1 with an add-on
carries switch and input keyed 0 alongside temperature keyed 100.
Signal Generator Client
The signal generator can be used to generate various signals including:
- Sine wave
- Square wave
- Triangle wave
- Random walk
Below is a screen-shot of the generated data displayed in Grafana.
Configuration
The signal generated can be configured with the following parameters:
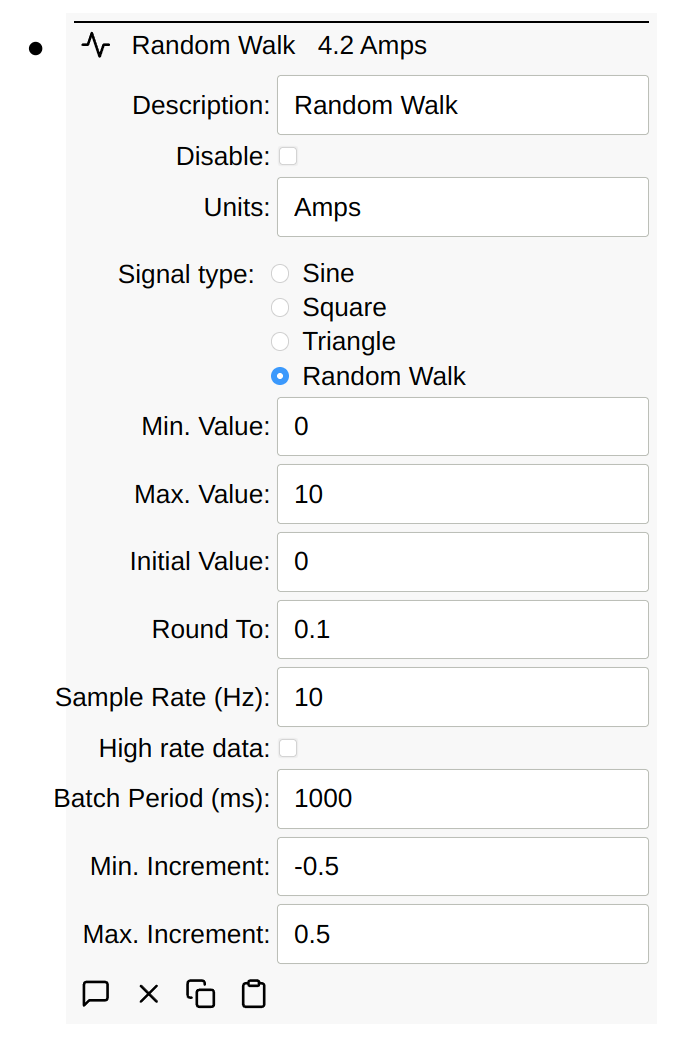
Most of the parameters are self-explanatory. With a Random Walk, you typically need to enter a negative number for the minimum. Increment as shown above. This causes the negative number generated to be negative roughly half the time.
The rounding can also be used to generate binary signals. Imagine a signal generator with these settings:
Max. value= 1Min. value= 0Initial value= 0Round to= 1Min. increment= -7Max. increment= 3Sample Rate= 20 milliseconds
Due to min/max/round to options, this is a binary value, either 0 or 1, biased
toward 0 (due to min/max increment options). This could be useful for
simulating binary switches or something like it. Effectively, this will hold the
value for at least 20m and picks a random number between -7 and 3. Due to
rounding, if value is currently 0, there’s a 25% chance it becomes 1. If 1,
there’s a 65% chance it becomes 0. This means that the value will be 0 roughly
91.25% (= 75% + (1 - 75%) * 65%) of the time.
Schema
signalType is sine, square, triangle, or random walk. frequency
applies to the three waveforms and minIncrement, maxIncrement, and roundTo
apply to a random walk. sampleRate is in Hz and batchPeriod is in
milliseconds.
A generator writes to itself unless it is told otherwise. A node configured to
write elsewhere carries a destination mapping, whose keys are nodeID,
parent, highRate, pointType, and pointKey. nodeID there is a key
rather than a point type, so it is written as the ID of the node it names rather
than as a description, which is worth knowing when moving a generator between
instances. The destination has to be the generator’s parent or a node below it;
a generator that names a node elsewhere in the tree does not run, and the reason
is shown as an error on its node.
Below is an export of several types of signal generator nodes:
nodes:
  - signalGenerator:
      batchPeriod: 1000
      description: Variable pulse width
      frequency: 1
      initialValue: "0"
      maxIncrement: 3
      maxValue: 1
      minIncrement: -7
      minValue: "0"
      roundTo: 1
      sampleRate: 5
      signalType: random walk
      units: Amps
      value: 1
  - signalGenerator:
      batchPeriod: 1000
      description: Triangle
      frequency: 1
      initialValue: "0"
      maxIncrement: 0.5
      maxValue: 10
      minIncrement: 0.1
      minValue: "0"
      sampleRate: 100
      signalType: triangle
      value: 6.465714272450723e-12
  - signalGenerator:
      batchPeriod: 1000
      description: Square
      frequency: 1
      initialValue: "0"
      maxValue: 10
      minValue: "0"
      sampleRate: 100
      signalType: square
      value: 10
  - signalGenerator:
      batchPeriod: 1000
      description: Sine
      frequency: 1
      initialValue: "0"
      maxValue: 10
      minValue: "0"
      sampleRate: 100
      signalType: sine
      value: 4.999999999989843
  - signalGenerator:
      batchPeriod: 1000
      description: Random Walk
      frequency: 1
      initialValue: "0"
      maxIncrement: 0.5
      maxValue: 10
      minIncrement: -0.5
      minValue: "0"
      roundTo: 0.1
      sampleRate: 10
      signalType: random walk
      units: Amps
      value: 9.1
Synchronization
Simple IoT provides for synchronized upstream connections via NATS or NATS over WebSocket.
To create an upstream sync, add a sync node to the root node on the downstream
instance. If your upstream server has a name of myserver.com, then you can use
the following connections URIs:
nats://myserver.com:4222(4222 is the default NATS port)ws://myserver.com(WebSocket unencrypted connection)wss://myserver.com(WebSocket encrypted connection)
IP addresses can also be used for the server name.
Auth token is optional and needs to be configured in an environment variable for the upstream server. If your upstream is on the public internet, you should use an auth token, or better, a device credential, which limits each device to its own data and can be revoked on its own. If both devices are on an internal network, then you may not need either and you can connect without any authentication.
Typically, wss are simplest for servers that are fronted by a web server like
Caddy that has TLS certs. For internal connections, nats or ws connections
are typically used.
Occasionally, you might also have edge devices on networks where NATS outgoing
connections on port 4222 are blocked. In this case, it’s handy to be able to use
the wss connection, which just uses standard HTTP(S) ports.
How synchronization behaves
Synchronization works by replicating the JetStream streams that store each instance’s data — see the synchronization reference for how this works. The behavior you will observe:
- First connect: the device announces itself and appears under the upstream root node; its full tree (structure, configuration, and history) then arrives through replication. Configuration written on the upstream for a device that has not connected yet is delivered on first connect.
- Offline changes catch up. Changes made on either side while the connection is down are delivered when it comes back — replication resumes exactly where it left off, and only missed data is sent. See Queuing while offline below.
- Both sides can edit. Configuration can be changed on either instance; the newest change wins everywhere.
- Deleting a device on the upstream detaches it. The device keeps running standalone and does not add itself back; undelete the device node on the upstream to resume synchronization.
Queuing while offline
An edge instance does not need its upstream to keep working. It writes every point to its own local store first, and the sync client replicates that store upstream. When the connection drops, the instance keeps collecting data, running rules, and accepting local configuration changes, all of which queue on disk.
On reconnect:
- The backlog is sent in order, with the original timestamps, so history upstream has no gap.
- Only the missed messages are sent. Replication resumes at the position it reached before the outage, which keeps the recovery cheap on a metered or low bandwidth link.
- Clients that act on current values (rules, protocol clients, the UI) see one update per changed value once the backlog drains rather than a replay of every intermediate reading, so a device coming back online does not re-trigger rules on stale data.
- History consumers still receive every point. A Db client feeding a time-series database reads the stream with its own durable consumer, so the backlog reaches the database as well.
Configuration written upstream while a device is offline, or before it has ever connected, waits and is delivered on the next connect.
How long a device can be offline and still catch up in full depends on how much history the store keeps. The default is 20,000 points per value, which is adjustable per instance. See Store for the setting, and the synchronization reference for how the queuing works.
Schema
The configuration of a sync node:
nodes:
  - sync:
      authToken: your-auth-token
      description: Cloud
      disabled: 0
      uri: wss://myserver.com
uri is the upstream connection, written as one of the forms described above.
authToken matches SIOT_AUTH_TOKEN on the upstream server. Leave it out to
connect with the instance’s device key instead; the
client then writes the public key on the node as pubKey, which is why an
export of a running node carries one.
A sync node belongs on the root node of the downstream instance, so a file that
carries one leaves parent out and it attaches to the device node this instance
runs as.
An export carries authToken as it was entered, so treat a file that contains
sync nodes the way you would treat the token itself.
The count of synchronizations is a point the client maintains, so an export of a running node carries it as well.
The client also maintains txBytes and rxBytes, the total bytes sent to and
received from the upstream. These count at the network socket, so they include
TLS, NATS protocol, and reconnect traffic, which is useful when estimating
cellular data usage. The totals continue across restarts and update every
bytesReportPeriod seconds, once an hour when it is not set. txBytesReset and
rxBytesReset start each one over. Enrollment requests are not included.
Device credentials
Every instance has a device key, generated the first time it starts and kept in
device.nkey under SIOT_DATA. The key is the instance’s identity when it
connects to an upstream: a sync node with no authToken signs the upstream’s
connection challenge with it, so the secret never leaves the device, and only
the server process reads the file. The public half is shown on the sync node as
pubKey, and siot key show prints it.
A sync node may also carry caCert, a PEM certificate the upstream’s TLS chain
has to be signed by. With it set, the device accepts only an upstream whose
certificate chains to that one, whatever the system certificate store says.
Leave it out to trust the system store.
An upstream accepts a device key when a deviceCred node under the device’s
node carries the matching pubKey. The credential limits the connection to that
one device: it can push its own data and pull the configuration written for it,
and nothing else. A device cannot publish as another device or read another
device’s configuration, and the upstream holds only public keys, so an export or
a copy of its store gives away nothing that could impersonate a device. The
security reference lists exactly what a credential
allows.
Revoking access is one action: disable the credential (or delete it, or delete
the device node) and the upstream closes the device’s connection and refuses it
from then on. Nothing else in the fleet is affected. The device keeps running on
its own, shows credential refused by upstream on its sync node, and tries
again every minute, so re-enabling the credential brings it back with everything
it queued while it was out.
The upstream records lastConnect and connected on each credential, which is
how to tell whether a device has connected. siot cred list shows every
credential with its device and state; siot cred disable ID,
siot cred enable ID, and siot cred rm ID change one, and
siot cred add -device ID -pubKey KEY enrolls a key by hand for a device node
that already exists. All of the siot cred commands take the usual
-natsServer and -token options, so they work against a remote upstream.
There are two ways to get a device connected. Pick one per fleet.
1. SIOT_AUTH_TOKEN
The simplest setup is one shared token: set SIOT_AUTH_TOKEN on the upstream
and put the same value in authToken on every device’s sync node. Nothing has
to be created per device. The trade-off is that the token grants full access to
the upstream, so every device can read and write everything, and locking one
device out means changing the token everywhere. This suits a handful of devices
on a private network. For a fleet on the public internet, use enrollment.
2. Devices that enroll themselves
Every instance generates its own key on first start, and an enrollment token lets it ask the upstream for a credential for that key. Nothing is copied by hand in either direction, and the device’s node appears on the upstream on its own:
-
On the upstream, set
SIOT_AUTH_TOKENandSIOT_DEVICE_AUTH=required(or start it withsiot serve -deviceAuth required). The upstream then accepts the shared token only from its own host, where its own client and thesiotcommands use it, and every remote connection needs a credential. Enrollment does not use the shared token, so nothing below depends on it. See configuration. -
On the upstream, add an Enrollment token node under the root and press Generate token, or run
siot cred token -description fleet. The token is shown once; only its hash is stored. Auto approve (-autoApprove) skips the approval step, and an expiry (-expires 720h) limits how long the token works. -
Put the token on each device’s sync node as
enrollToken, with noauthToken. In an image that is one line in the provisioning file:nodes: - sync: description: Cloud uri: wss://myserver.com enrollToken: ETXXXX... -
When the upstream refuses the device’s key, the device connects with the token and that key, which together allow exactly one thing, and asks for a credential for it. The upstream creates the device node if it is new and a credential under it marked pending approval; the device’s sync node says
enrollment pending approval on upstreamand keeps trying every minute. -
Approve the credential: uncheck Pending on it, or run
siot cred approve ID(siot cred listshows pending ones). The device connects on its next try.
A fleet that already syncs with the shared token moves over the other way round:
enroll every device first, then set SIOT_DEVICE_AUTH=required, since a device
still carrying an authToken is refused from then on.
Revoking the enrollment token, by disabling or deleting its node, stops new enrollments and does not affect devices already enrolled. A device that enrolls again with a different key gets a second, pending credential, even under a token that approves automatically; the approved one is never replaced without an operator. At most 100 devices may wait for approval at once, so a token that has leaked cannot fill the tree.
Users on a device are replicated to the upstream with the rest of the device’s tree, but they sign in on the device only; see users and groups.
Videos
There are also several videos that demonstrate upstream connections:
Simple IoT upstream synchronization support
Simple IoT Integration with PLC Using Modbus
Update
The Simple IoT update client facilitates updating software. Currently, it is designed to download images for use by the Yoe Updater. The process can be executed manually, or there are options to automatically download and install new updates.
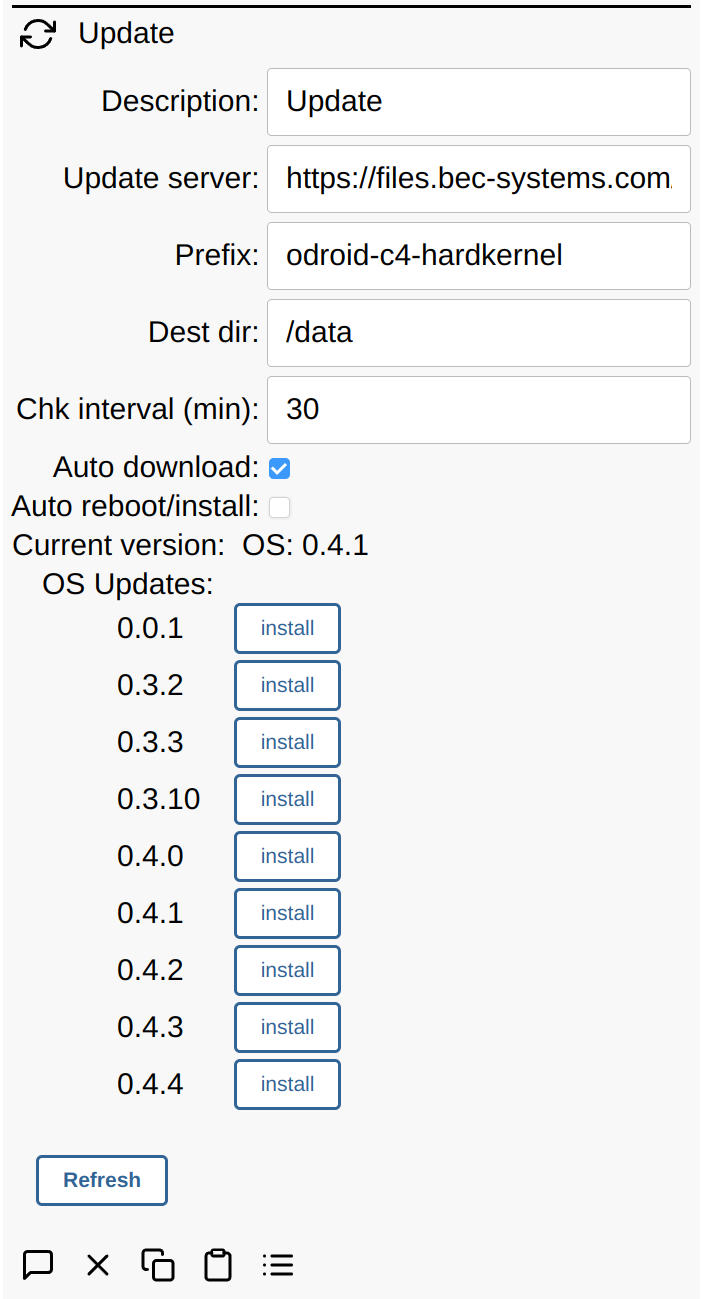
There are several options:
- Update server: HTTPS server that contains the following files. The URI
must use
https; the update image is not signed, so a plainhttpserver would let anyone on the network path replace it.files.txtis limited to 1 MiB and an update image to 1 GiB. A download that would not leave 64 MiB free in the destination directory does not start, so a large image cannot fill the disk.- files.txt: contains a list of update files on the server
- update files named:
<prefix>_<version>.updversionshould follow Semantic Versioning:MAJOR.MINOR.PATCHprefixmust match what the updater on the target device is expecting typically host/machine name.
prefix: described above - typically host/machine name. This is auto detected on first startup, but can be changed if necessary.Dest dir: Destination directory for downloaded updates. Defaults to/data.Chk interval: time interval at which the client checks for new updates.Auto download: option to periodically check the server for new updates and download the latest version.Auto reboot/install: option to auto install/reboot if a new version is detected and downloaded.
Schema
The configuration of an update node:
nodes:
  - update:
      autoDownload: 1
      autoReboot: 0
      description: Updates
      directory: /data
      pollPeriod: 60
      prefix: myboard
      uri: https://updates.example.com
pollPeriod is how often the server is checked, in minutes, and defaults to 30
when it is zero or missing. directory defaults to /data.
prefix is detected on first startup, so a file usually leaves it out and lets
each unit fill in its own; give it only when every unit the file applies to
expects the same one.
The versions found on the server, the version downloaded, and the current OS version are points the client maintains, so an export of a running node carries them as well.
USB
Browser
The browser client enables control and configuration of the
Yoe Kiosk Browser as it is
when installed as part of Yoe Distro. On changing the configuration, changes are
saved to /etc/default/yoe-kiosk-browser for the browser and
/etc/default/eglfs.json for EGLFS, and the yoe-kiosk-browser service is
restarted automatically.
Schema
Below is an export of a browser node:
nodes:
  - browser:
      debugport: "9222"
      defaultdialogs: 0
      description: Kiosk
      dialogcolor: "#1c1c1c"
      disabled: 0
      disablesandbox: 1
      displaycard: /dev/dri/card0
      exceptionurl: http://localhost:4223/offline.html
      fullscreen: 1
      ignorecerterr: 0
      keyboardscale: 1
      retryinterval: 10
      rotate: 0
      screenresolution: 1920x1080
      touchquirk: 0
      url: http://localhost:4223
The point types are lower case throughout, which matches the settings written to
/etc/default/yoe-kiosk-browser. Checkboxes are stored as 1 and 0.
debugport is text, so it is quoted; rotate and retryinterval are numbers.
displaycard and screenresolution are the two settings that land in
/etc/default/eglfs.json.
PLCs
Simple IoT can exchange data with programmable logic controllers. There is no single PLC client; a PLC speaks one or more protocols, and you use whichever client supports the protocol you have available. This page describes the approaches, what each one requires on the PLC side, and which ones are implemented today.
The examples focus on Allen-Bradley ControlLogix and CompactLogix controllers (the Logix 5000 family), because those are the most commonly asked about, but the same approaches apply to Siemens, Beckhoff, Omron, and others.
Approaches marked (planned) describe work that has not been implemented yet. They are documented here so you can plan around them and so the design is open for discussion on the community forum.
Choosing an approach
| Protocol | Client | Status | Tag names preserved | Work required |
|---|---|---|---|---|
| Modbus | Modbus | Available | No | PLC-side Modbus server |
| MQTT | MQTT | Available | Yes | A gateway that publishes PLC tags |
| Sparkplug B | MQTT | Available | Yes | A gateway that speaks Sparkplug |
| OPC UA | OPC UA | (planned) | Yes | Enable the server on the PLC |
| EtherNet/IP | Logix | (planned) | Yes | None beyond network access |
| Anything else | A process of your own over the NATS API | Available | Depends | A process you write |
A few questions usually settle the choice:
- Does the PLC already publish to a broker or historian? If a gateway such as Kepware or Ignition is already installed and licensed, MQTT reuses it. You do not need to add a broker to go this route, since Simple IoT can serve MQTT itself.
- Do you want Simple IoT to be the edge gateway? If so, reading tags directly over OPC UA or EtherNet/IP avoids a second box and a second license.
- How many values, and how often do they change? A handful of stable values is a good fit for Modbus. Hundreds of values, or a tag list that changes as the PLC program is edited, is not.
- What firmware are the Logix controllers on? From v36 they include an OPC UA server, which changes the answer considerably. See OPC UA.
- Is the controller an open Linux platform? Products such as Opto 22 groov and Phoenix Contact PLCnext publish MQTT themselves and can run Simple IoT on the controller. See other controllers.
- Does the site already run Ignition? If so, taking data across that boundary is often less work than connecting to each controller again. See Ignition.
Modbus
This works today and needs no additional Simple IoT code. See the Modbus page for how to configure a bus and its IOs.
Logix controllers do not act as Modbus servers out of the box, so the work is on the PLC side. Common options:
- Add-on instructions using the controller’s socket object. Rockwell publishes sample add-on instructions that implement Modbus TCP on the embedded Ethernet port of CompactLogix 5370/5380 and ControlLogix 5580 controllers. The instruction maps an array or user-defined type to a block of Modbus registers. No extra hardware, but it consumes controller scan time and socket resources.
- A backplane communication module, such as those from ProSoft, that presents a Modbus TCP or RTU interface and exchanges data with the controller over the backplane.
- A standalone protocol gateway that speaks EtherNet/IP on one side and Modbus on the other.
Once the PLC serves Modbus, add a modbus node in Simple IoT with protocol
set to TCP, clientServer set to client, and uri set to the controller or
gateway address. Add one modbusIo child for each value:
nodes:
  - modbus:
      clientServer: client
      description: Line 3 controller
      pollPeriod: 1000
      protocol: TCP
      timeout: 500
      uri: 192.168.1.50
      children:
        - modbusIo:
            address: 100
            dataFormat: float32
            description: Tank level
            id: 1
            modbusIoType: modbusHoldingRegister
            readOnly: 1
            scale: 1
            units: cm
What to plan for
Modbus carries register numbers rather than tag names, so a few constraints follow from the protocol itself:
- You maintain a register map by hand in both the PLC program and the Simple IoT configuration. Nothing detects when the two drift apart, so treat the map as part of the PLC program’s documentation and review it whenever the program changes.
- 32-bit values occupy two registers, and the word order varies between
implementations. If a
float32orint32reads as an implausible number, try the swapped data format. - Strings, arrays, and user-defined types do not map cleanly. Flatten what you need into individual registers on the PLC side.
- Reads are polled. Set
pollPeriodto the slowest rate that still meets your needs, since every IO is read on every cycle.
Modbus suits a stable set of tens of values. Beyond that, the register map becomes the limiting factor.
MQTT
MQTT is the most common way to get data out of a plant network and into something else, and it is the transport underneath Sparkplug B, described below. Three pieces are involved:
- Something on the PLC side that reads tags and publishes them.
- A broker. Simple IoT provides this itself, described next.
- A mapping from published messages into Simple IoT points.
The broker is already built in
Simple IoT embeds a NATS server, and NATS includes an MQTT server. It needs JetStream, which Simple IoT already runs, so exposing it is a matter of opening a port rather than adding a dependency. A gateway or sensor then publishes directly to Simple IoT, with no Mosquitto, HiveMQ, or EMQX to deploy, secure, and update. On an edge device that is one fewer process to keep running.
The configuration is a port setting alongside the existing NATS port options, disabled by default:
SIOT_NATS_MQTT_PORT=1883
Points worth knowing about the NATS MQTT server:
- It implements MQTT 3.1.1. Clients that require MQTT 5 are refused, which matters mostly for newer gateways that default to version 5.
- QoS 0, 1, and 2 are supported. Sessions and retained messages are stored in JetStream, so they survive a restart.
- Published messages become NATS subjects, so anything already connected to
Simple IoT over NATS can see them. Topic levels convert as
/to., and a literal.in a topic converts to//. A Sparkplug topic ofspBv1.0/plant/DDATA/line3/tanktherefore arrives on the NATS subjectspBv1//0.plant.DDATA.line3.tank. - MQTT connections authenticate with the Simple IoT auth token, supplied in the password field of the connect packet. Use TLS whenever the connection leaves a trusted network.
An external broker still makes sense when the plant already runs one, when you need to bridge several sites, or when you need broker features such as clustering or fine-grained access control. Connecting to an external broker as a client is planned as well, so the choice stays open.
Getting the data out of the PLC
Logix controllers do not publish MQTT in a form worth depending on, so a gateway reads tags over EtherNet/IP and republishes them. Products in common use include Kepware’s IoT Gateway, Ignition Edge with Cirrus Link MQTT Transmission, HighByte Intelligence Hub, FactoryTalk Edge Gateway, and Opto 22 groov EPIC. All are licensed products and become a second system to maintain, which is the main argument for reading tags directly, described in the next section.
Turning messages into points
A subscription node maps a topic to points. Leaving the broker address blank means the server built into this instance:
nodes:
  - mqtt:
      description: Plant data
      uri: "" # blank uses the built-in MQTT server
      disabled: 0
      children:
        - mqttSub:
            description: Tank level
            topic: plant/line3/tank/level
            path: $.value
            units: cm
Payloads are JSON, which covers the AWS IoT, Azure IoT, and gateway-defined formats that most installations use. ADR-8 compares these payload formats against the Simple IoT point model, and the MQTT page covers the settings in full.
Do topics become nodes automatically?
Only when you say what the topic levels mean, and always for Sparkplug B. The difference is whether the data describes itself.
A plain MQTT topic tree looks like it should map onto the node graph, and sometimes it does. But nothing in the protocol says which topic level is a device and which is a measurement, or what the payload contains. Subscribing to a wildcard on a busy plant broker and creating a node for everything that arrives would fill the store with nodes nobody asked for, and synchronization would carry them upstream. So nothing is created until you supply the missing information.
A topic schema supplies exactly
that: topicSchema: "{site}/{gateway}/{device}" on the MQTT node declares that
the first level is a site, the second a gateway, and the third a device, and
matching topics create those nodes as data arrives. Everything past the named
levels becomes the point key, so a rogue deep topic extends a key rather than
the node tree, and a maxNodes limit guards against a level carrying an
unbounded value. Nodes are matched by the topic level they came from, so
renaming one or adding tags to it survives, and nothing is ever deleted
automatically – a quiet sensor and a removed sensor look the same from outside.
Browsing a broker with no topic convention at all, the way the Shelly client finds devices on the network, is still worth having and is not implemented yet.
Sparkplug B is a different situation, and this is a large part of why it exists. An edge node announces itself with a birth certificate that lists every metric with its name and data type, and the topic namespace already separates the group, the edge node, and the device. There is no guessing involved, so building the node structure automatically is the intended behavior: a group becomes a node, edge nodes and devices become nodes beneath it, and metrics become points.
Sparkplug B
Sparkplug B is an Eclipse specification that adds a defined topic namespace, a protobuf payload, and a state model on top of MQTT. It is widely used in Industry 4.0 installations, and most of the gateways listed above speak it, so it is the format you are most likely to meet in a plant that has already done this work.
What it adds over plain MQTT:
- A defined topic namespace,
spBv1.0/{group}/{message type}/{edge node}/{device}, so the structure of the plant is carried in the topic rather than agreed on privately between the publisher and each consumer. - Birth and death certificates. An edge node publishes an NBIRTH listing every metric it will report, with names, data types, and initial values, and registers a death certificate with the broker so consumers learn immediately when it drops off. This means a consumer that connects later can discover the full tag list rather than guessing from traffic.
- Report by exception with aliases. After the birth message, values are sent on change and referenced by a numeric alias rather than the full name, which keeps the data volume low on constrained links.
- A defined state model for primary host applications, so publishers know whether the consumer that matters is online.
The structure maps onto the Simple IoT graph directly: a group becomes a node,
each edge node and device becomes a node beneath it, and each metric becomes a
point. Because a birth certificate enumerates the metrics, Simple IoT builds
that structure as edge nodes announce themselves rather than having you
configure it, which is the same idea as browsing the tag list of a Logix
controller. Set sparkplug: true on an mqtt node and everything below it
appears as the gateway publishes; the MQTT page covers
what arrives and how it is named.
Acting as a primary host application, which is what the state topic is for, and publishing Simple IoT data outbound as Sparkplug are the remaining pieces.
OPC UA (planned)
OPC UA (IEC 62541) is the vendor-neutral standard for industrial data exchange, and it is the single client that would cover the widest range of hardware. It is not implemented yet.
Reaching OPC UA data today
OPC UA data can already flow into Simple IoT through the MQTT client. Several products collect from OPC UA servers and publish to MQTT, among them Idako, Prosys Forge, and Takebishi DeviceGateway, which also collects from sources other than OPC UA. A number of MQTT brokers include an OPC UA connector as well. If one of these is already running in the plant, this path works today and needs nothing new in Simple IoT.
A native client is still worth having for installations that would rather not add another process between the controller and Simple IoT.
What already has an OPC UA server
Most modern controllers, and this now includes Allen-Bradley:
- Logix 5380, 5580, and 5590 controllers have a native OPC UA server from firmware v36, disabled by default and enabled in the controller configuration. If your controllers are on v36 or later, this is the most direct path available today for reading tags by name, with no add-on instruction, gateway, or license involved.
- CompactLogix 5480 hosts FactoryTalk Linx Gateway on its Windows side to serve OPC UA. Older Logix controllers need FactoryTalk Linx Gateway or a product such as Kepware.
- Siemens S7-1200 and S7-1500 include a server, as do Phoenix Contact PLCnext, Beckhoff TwinCAT, and B&R controllers.
- Ignition and most gateway products expose one as well, so OPC UA is often a way to reach data that has already been collected.
Why it fits Simple IoT well
- One client covers many vendors. Every other option on this page is specific to a protocol or a product line.
- The address space is browsable, and carries tag names, data types, and engineering units. Simple IoT can create the node structure by browsing the server, the same idea as a Sparkplug birth certificate or a Logix tag list, rather than having you type node IDs.
- Subscriptions rather than polling. You register the values you care about with a publishing interval and an optional deadband, and the server sends changes. This scales considerably better than a poll loop.
- Values arrive with context. Each update carries a source timestamp and a status code, so a stale or bad reading is distinguishable from a good one. Points already carry a timestamp; representing status is a question to settle when the client is built.
What it would look like
# planned, subject to change
nodes:
  - opcua:
      description: Line 3 controller
      endpoint: opc.tcp://192.168.1.50:4840
      securityPolicy: Basic256Sha256
      securityMode: SignAndEncrypt
      publishInterval: 1000
      disabled: 0
      children:
        - opcuaNode:
            description: Tank level
            nodeId: ns=2;s=Tank_Level_PV
            deadband: 0.5
            scale: 1
            offset: 0
            units: cm
gopcua is the likely dependency. It is a native Go implementation with browsing, subscriptions, and the standard security policies, it is used in production elsewhere including Telegraf, and staying in pure Go keeps the single static binary and the ARM builds intact.
The part that takes the work
Security is where OPC UA costs more than the other options. A client presents an application instance certificate, and the server has to be told to trust it, which is usually a manual step in the server’s own configuration. On top of that sit the security policy, the message mode, and the user token. Simple IoT would need to generate and store a certificate, present it, and show you why a connection was rejected. The specification is helpful here: an untrusted certificate, a rejected identity token, and a failed user authentication each come back as a distinct status code, so the reason is available. The work is in surfacing that detail rather than reporting a generic connection failure.
Anonymous connections with no security are common on isolated plant networks and are the quickest way to get a first reading, but they are not a good place to stop. See the security reference for how Simple IoT handles certificates elsewhere.
Beyond reading values
A useful client is browse, read, write, and subscribe. The rest of the specification is much larger, and none of it is needed to get data flowing:
- Historical access, for pulling archived values out of a server that keeps them.
- Methods, for calling functions the server exposes.
- Alarms and events, which would map onto notifications.
- OPC UA PubSub, which publishes over MQTT or UDP rather than a client session. Since Simple IoT already contains an MQTT server, receiving PubSub data would build on the same work as the MQTT client.
Serving OPC UA is the other direction worth considering. Exposing Simple IoT nodes as an address space would let existing SCADA software read Simple IoT data without any of it needing to know what Simple IoT is.
EtherNet/IP tags (planned)
Reading Logix tags over EtherNet/IP means no gateway, no license, and no register map. It is not implemented yet.
This overlaps with OPC UA, which reaches the same tags on firmware v36 and later through a standard that also covers other vendors. Where an EtherNet/IP client still earns its place is on controllers older than v36, which is a large installed base, and on sites that would rather not enable another server on the controller.
The intended design is a logix node holding the controller connection, with a
child node per tag:
# planned, subject to change
nodes:
  - logix:
      description: Line 3 controller
      uri: 192.168.1.50
      path: "1,0" # backplane slot
      pollPeriod: 1000
      disabled: 0
      children:
        - logixTag:
            description: Tank level
            tag: Tank_Level_PV
            scale: 1
            offset: 0
            units: cm
Because Logix controllers can report their own tag list, Simple IoT could browse the controller and create the child nodes for you, rather than having you type each tag name. That is the part that makes this approach meaningfully better than the alternatives.
Implementation notes for anyone interested in helping:
- gologix is a pure Go implementation of the Logix CIP services and is the likely dependency. Staying in pure Go keeps the single statically linked binary and the cross-compilation story intact.
- libplctag is more widely proven but is a C library, so using it would require cgo and give up the above.
- Reading many tags in one multi-service request matters for performance; reading them one at a time does not scale past a few dozen.
- Controllers limit the number of concurrent connections, so one connection per
logixnode is the right granularity.
Writing to a PLC
Simple IoT clients use a valueSet point to request a change and a value
point to report what was read back, so writes fit the existing pattern in every
approach above. The Modbus client supports this today through the readOnly
setting on each IO.
Writing into a running machine deserves a conversation with whoever owns it. Consider leaving IOs read-only unless a write is genuinely required, and putting range and interlock checks in the PLC program rather than relying on the value sent from outside.
Data types
Each point carries a data type along with its data, so a PLC value keeps the shape it had in the controller rather than being flattened into a single numeric field. The types currently defined are float, int, string, and JSON, and the set can be extended when a PLC type needs a representation that does not fit the existing ones.
| PLC type | Point data type |
|---|---|
| BOOL | int, 0 or 1 |
| SINT, INT, DINT | int |
| REAL | float |
| STRING | string |
| Arrays | One point per element, distinguished by the point key |
| User-defined type | One point per member, or a child node (planned) |
The scale and offset fields convert raw values into engineering units:
value = raw * scale + offset. They apply to numeric types.
Deciding how to represent user-defined types is the open question. A flat structure, with one point per member named by the member path, keeps the CRDT properties that synchronization depends on and is the likely starting point. A JSON point is available for cases where the structure is better kept intact, at the cost of merging the whole value as a unit. ADR-1 covers the reasoning behind the point data types.
Text data
Most of what a PLC reports is numeric, but text appears often enough to plan for. Where it shows up is fairly consistent across plants: batch, lot, recipe, and part numbers; barcode and RFID reads; serial numbers being recorded for traceability; operator or badge IDs; work order numbers; machine state and alarm text; and firmware or program version strings.
Logix controllers have a STRING type, which is a structure holding a length
and a character array, and OPC UA and Sparkplug B both carry strings natively.
Modbus does not have a string type at all, so devices that report one pack ASCII
into consecutive registers, two characters per register, by local convention.
The useful observation is that this text is almost always identity or context for the numeric data rather than a measurement in its own right. Nobody graphs a batch number; they want to know which batch a temperature trace belongs to. That distinction decides where it should go:
- Text that changes slowly and describes the thing producing data belongs on a tag point, where it becomes a label on every point emitted beneath it. A line, a machine, or an installed product variant fits here.
- Text that changes with production is where care is needed. A batch number as a tag gives you exactly the query you want, at the cost of a new series per batch. That is affordable for batches lasting hours and not affordable for something changing every few seconds.
- State and status are better stored as numbers with a lookup. A machine state written as an integer graphs and alarms cleanly, and Grafana value mappings display the names. Historians have handled enumerations this way for a long time, and it is worth doing even when the PLC has the state as a string.
- Alarm and event text is a poor fit for a time series database in any form. In Simple IoT it maps better onto notifications.
Text is stored in points and kept in the store regardless, so the current value is visible in the UI and available over the API, and its history is in the store. What text does not do today is reach VictoriaMetrics, which converts non-numeric values to zero, so the Database client skips string points rather than filling the database with zeros.
If a string has to be queryable in VictoriaMetrics and does not suit a tag, the
established pattern is an information series: a value of 1 carrying the string
as a label, joined onto the real measurement at query time with group_left.
That is worth knowing about, though for most PLC data a tag point is the simpler
answer.
Graphing PLC data
None of the clients on this page write to a time series database themselves. They create nodes and publish points, and a Database node writes those points to VictoriaMetrics or InfluxDB, where Grafana reads them. So the question of how a PLC tag or an MQTT topic ends up as a queryable series is really a question about what nodes and points the client creates, and the answer is the same whichever protocol brought the data in.
What a point becomes
Every point written to VictoriaMetrics arrives as the metric points_value,
with these labels:
| Label | Comes from |
|---|---|
type | The point type, such as value |
key | The point key, used for arrays and maps |
node.id | The node that emitted the point |
node.type | The node type, such as modbusIo or mqttSub |
node.description | The node’s Description field |
node.tag.* | Tag points on the node, and on its ancestors |
That last row is what makes plant structure queryable. A tag point set once on a node is inherited by every point emitted beneath it, up to the Database node’s parent, so a site or line or machine label is set in one place rather than repeated on every sensor. The database page covers the rules, including that the value nearest the emitting node wins.
How this is usually done elsewhere
The common tool for MQTT into a time series database is Telegraf’s
mqtt_consumer input, and it does two things worth knowing:
- It stores the whole topic as a tag named
topic, by default. You can turn that off withtopic_tag = "". - It also parses the topic into separate tags, through
topic_parsingrules that assign each topic level to a measurement, a tag, or a field.
InfluxData’s own guidance is that the whole topic on its own needs extra
processing before it is useful, and that parsing the levels into distinct tags
is what makes the data queryable. Other tools take the same approach by
different means; mqtt2prometheus, for example, pulls labels out of the topic
with a regular expression.
So the answer to whether you store the entire topic is usually “yes, and also the parsed levels”. The full topic is worth keeping for tracing a series back to its source and for selecting one exact series. It is not a good primary label, because a query that wants every tank level on line 3 cannot express that against an opaque string.
How it maps in Simple IoT
The topic hierarchy becomes the node hierarchy, and the levels you want to query
on become tag points. Given a topic of plant-a/line3/press/tank_level carrying
{"value": 42.1}:
plant-a              tag: site=plant-a
└── line3            tag: line=3
    └── press        tag: machine=press-3
        └── Tank level   (mqttSub, topic: plant-a/line3/press/tank_level)
                         tag: topic=plant-a/line3/press/tank_level
The point emitted by that subscription node is written as:
points_value{type="value",
             "node.description"="Tank level",
             "node.tag.site"="plant-a",
             "node.tag.line"="3",
             "node.tag.machine"="press-3",
             "node.tag.topic"="plant-a/line3/press/tank_level"}
Label names contain periods, so MetricsQL queries quote them. Every tank level on line 3, regardless of machine:
points_value{type="value", "node.tag.line"="3", "node.description"="Tank level"}
Storing the full topic as a tag point named topic is the same idea as
Telegraf’s default, and it needs nothing new in the Database client, since it is
an ordinary tag point.
Choosing the point shape
Two arrangements both work, and the payload usually decides:
-
A node per measurement, with a point of type
value. This matches how Modbus IOs already work, and suits topics that carry a single scalar. -
A node per device, with one point per field, where the point key holds the field name. A payload with twenty fields becomes one node and twenty points rather than twenty nodes, and the field name is queryable as the
keylabel:points_value{type="value", key="tank_level", "node.tag.machine"="press-3"}
For Sparkplug B the structure is already decided by the specification: the group, edge node, and device become nodes, which means they become inherited tags without any configuration, and each metric becomes a point.
Things to plan for
- Keep unbounded values out of tags. Each distinct combination of labels is a separate series, and series count is what makes a time series database slow, not label length. A topic level holding a message ID or a timestamp should not become a tag, and where topics carry one, storing the full topic is a poor idea as well.
- Settle tag names before collecting history. Editing a tag or a description starts a new series from that moment, and a query spanning the change sees both.
- Publish numbers, not strings. VictoriaMetrics converts non-numeric values to zero, so the Database client skips string points entirely.
Other controllers
The Logix approach above assumes a closed controller that you can only reach over the network. Several popular platforms are more open than that, which changes what is worth doing.
Any controller that serves Modbus TCP or RTU works today with no additional code, which includes most Siemens, Omron, Schneider, and WAGO products, either natively or through a communication module.
Opto 22 groov EPIC and groov RIO
These are among the easiest controllers to work with, because the protocols are in the firmware rather than in a separate gateway:
- A Modbus/TCP server is available out of the box, so the Modbus client works with them today.
- MQTT with Sparkplug B or string payloads is built into the firmware and configured from groov Manage, with no gateway software or license involved. Combined with the MQTT server built into Simple IoT, a groov RIO can publish straight into Simple IoT with nothing in between.
- A REST API covers the I/O channels, with a Swagger document built into the device. A process of your own can poll it and publish points today, as described below.
- The controller runs Linux, and a free shell license enables SSH, with container support on firmware 4.0.0 and later. See running Simple IoT on the controller.
Opto 22 treats shell access as an advanced, self-supported option, so weigh that against how much you value keeping everything on one device.
Phoenix Contact PLCnext
PLCnext controllers run Linux alongside the IEC 61131 runtime and are designed for adding your own software:
- Modbus TCP and OPC UA are available, so Modbus works with Simple IoT today.
- A gRPC data interface exposes the Global Data Space, so an external program can read and write controller variables by name. Phoenix Contact publishes the protocol definitions, and Go is a first-class gRPC language, so a PLCnext client would be similar in shape to the Logix client described above and would read tags by name rather than by register. This is a reasonable candidate once the Logix client exists (planned).
- Container support has been available since firmware 2020.0, and the controllers are ARM-based, so Simple IoT can run on the device.
Running Simple IoT on the controller
Both platforms above run Linux on ARM and allow you to install your own
software, which opens an option that a Logix controller does not. Simple IoT is
a single statically linked binary with no runtime dependencies, and
siot_build_arm and siot_build_arm64 produce builds for these processors, so
it can run on the controller itself rather than on a separate computer beside
it.
That removes the network hop: read process data through the local interface, store points on the device, and synchronize upstream when a connection is available. A few things to check before committing to it:
- The vendor’s support policy for running your own software.
- Available flash and its endurance, since the store writes to disk. The store reference covers the settings that affect this.
- What a firmware update does to anything you installed.
Siemens
The S7 protocol is not implemented. Siemens S7-1200 and S7-1500 controllers include an OPC UA server, so the OPC UA client would cover them without anything S7-specific. Until then, Modbus or the custom client approach below covers these cases.
Ignition
Ignition is a SCADA platform rather than a PLC, but it comes up often enough to be worth its own section: many plants already run it, and it is frequently the system that already has a connection to every controller on the floor. Where that is true, integrating with Ignition is usually less work than connecting to each PLC again.
Sparkplug B is the natural boundary between the two systems, and the Cirrus Link modules move data in both directions:
- MQTT Transmission publishes Ignition tags, including tags it reads from Logix and other controllers over OPC UA, as Sparkplug B. Simple IoT would subscribe to those (planned), and with the MQTT server built into Simple IoT it can be the broker that Transmission publishes to, so no separate broker is required.
- MQTT Engine subscribes to a broker and turns Sparkplug messages into Ignition tags. If Simple IoT publishes Sparkplug (planned), data from Simple IoT nodes appears in Ignition alongside everything else, which is a practical way to get edge data onto existing screens and into existing alarm configurations.
Ignition also exposes an OPC UA server, so an OPC UA client would be another path to the same data. Ignition Edge runs on hardware such as groov EPIC, which is worth knowing if you are choosing between running Ignition Edge and Simple IoT on the same device, or running both.
The two systems solve different problems and coexist well. Ignition is typically the plant-floor HMI and SCADA layer, while Simple IoT handles distributed state and configuration and synchronizes it between the edge and the cloud. Sending data across the boundary as Sparkplug lets each do what it is good at.
Writing your own integration
If none of the above fits, you can connect a process of your own to the Simple IoT NATS API and publish points into the store. That process can be written in any language with a NATS client, and can use whatever PLC library suits it. This is often the fastest path for a one-off protocol, and it keeps the protocol-specific code out of your Simple IoT deployment. See the integration page for the available integration points.
If the result is generally useful, consider contributing it as a client instead. The client reference describes what that involves.
Graphing Data
Simple IoT is designed to work with several other applications for storing time series data and viewing this data in graphs.
InfluxDB
InfluxDB is currently the recommended way to store historical data. This database is efficient and can run on embedded platforms like the Raspberry PI as well as desktop and server machines. To connect SIOT to InfluxDB, add a database node and fill in the parameters.
Grafana
Grafana is a very powerful graphing solution that works well with InfluxDB. Although InfluxDB has its own web interface and graphing capability, generally we find Grafana to be more full featured and easier to use.
Changing the Display name (labels) in Grafana
Often with an Influx query, we’ll get trace display names that look like the below:
Often, much of this data is irrelevant or redundant with the query. One way to change the label is with an Override:
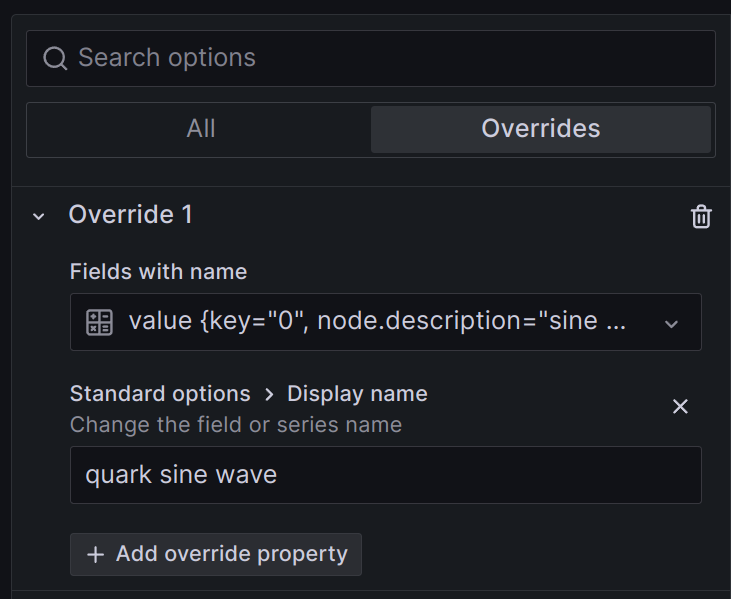
This can be tedious to set up and maintain.
Often a better way is to
add tags
to the nodes generating the data and then display the node tags in the display
name by using the Influx map function.
from(bucket: "siot")
  |> range(start: v.timeRangeStart, stop:v.timeRangeStop)
  |> filter(fn: (r) =>
    r._measurement == "points" and
    r._field == "value" and
    r.type == "value")
  |> filter(fn: (r) => r["node.type"] == "signalGenerator")
  |> map(fn: (r) => ({_value:r._value, _time:r._time, _field:r["node.tag.machine"] + ":" + r["node.description"]}))
In this case we are displaying the node machine tag and description. The result is very nice:
Configuration
Environment variables
Environment variables are used to control various aspects of the application. The following are currently defined:
- General
SIOT_HTTP_PORT: HTTP network port the SIOT server attaches to (default is one aboveSIOT_NATS_PORT, 4223)SIOT_DATA: directory where any data is stored, including the instance’s device key indevice.nkeySIOT_AUTH_TOKEN: auth token used for NATS and HTTP device API, default is blank (no auth)SIOT_DEVICE_AUTH:optional(the default) accepts the auth token from anywhere;requiredaccepts it only from this host, so remote devices need a device credential. See the security reference.SIOT_OUTBOUND_DENY_PRIVATE: set totrueto refuse connections a client makes to a loopback, link-local, or private address taken from a point: the metrics scraper’s URI, a Shelly device’sip, an ntfy server, a Modbus TCPuri, and a gpsd address. Everything is allowed by default, since an edge device talks to peers on its own network; set it on an instance that other people configure, such as one in the cloud, so its nodes cannot be used to probe the network it sits on. The check runs after the name is resolved.OS_VERSION_FIELD: the field in/etc/os-releaseused to extract the OS version information. Default isVERSION, which is common in most distros. The Yoe Distribution populatesVERSION_IDwith the update version, which is probably more appropriate for embedded systems built with Yoe. See ref/version.GOMEMLIMIT: the Go runtime’s soft memory limit. When it is not set and SIOT runs under a cgroup memory limit, such as a systemd unit’sMemoryMax, SIOT sets the Go limit to 90% of the cgroup limit, so the garbage collector works harder as memory nears the limit rather than the process being killed on reaching it. Set it to override that, or tooffto run with no Go limit.
- NATS configuration
SIOT_NATS_PORT: Port to run NATS on (default is 4222). The HTTP and monitoring ports follow it, so setting this alone moves a second instance on the same machine off the defaults; step it by 10 (4232, 4242, …).SIOT_NATS_MONITOR_PORT: Port for the NATS monitoring interface (default is two aboveSIOT_NATS_PORT, 4224; 0 turns it off). It needs no credentials and lists connections and subjects, so it listens on127.0.0.1only.SIOT_NATS_SERVER: the NATS server the process connects to (default isnats://127.0.0.1:followed bySIOT_NATS_PORT)SIOT_NATS_TLS_CERT: points to TLS certificate file. If not set, TLS is not used. These settings cover the NATS, MQTT, and NATS WebSocket listeners; the HTTP port is served without TLS, so put a reverse proxy in front of it. The server’s own connections over loopback, and the HTTP port’s WebSocket proxy, accept exactly this certificate, so it does not have to be issued forlocalhost.SIOT_NATS_TLS_KEY: points to TLS certificate keySIOT_NATS_TLS_TIMEOUT: Configure the TLS upgrade timeout. NATS defaults to a 0.5 second timeout for TLS upgrade, but that is too short for some embedded systems that run on low end CPUs connected over cellular modems (we’ve see this process take as long as 4 seconds). See NATS documentation for more information.SIOT_NATS_WS_ORIGINS: the web UI reaches NATS through the HTTP port, which proxies to a WebSocket listener on127.0.0.1at a port the system picks. This setting lists the page origins, comma-separated, allowed to open that WebSocket, such ashttps://siot.example.com. Empty (the default) allows any origin. WhenSIOT_AUTH_TOKENis set, a browser still has to present a user JWT to connect; with no token the listener accepts anonymous connections, so set both on an instance other people can reach.SIOT_NATS_MQTT_PORT: Port to serve MQTT on (disabled by default; 1883 is the conventional port). See the MQTT page.
- Provisioning
SIOT_PROVISIONING_DIR: directory of YAML files applied at start-up and whenever they change. If it is not set,<SIOT_DATA>/provisioningis used when that directory exists, so an image can ship the directory and say nothing else.SIOT_PROVISIONING_INTERVAL: how often to look for changes the directory watch and the tree subscription might have missed, written as a Go duration such as60s. The default is one minute.
- Particle.io
SIOT_PARTICLE_API_KEY: key used to fetch data from Particle.io devices running Simple IoT firmware
The configuration file format
One format describes a tree of nodes, and siot export, siot import, and
provisioning all use it. The node type is the key, and each point type is a key
of its own:
apiVersion: 1
nodes:
  - group:
      description: Sensors
      children:
        - modbus:
            description: Modbus sensors
            port: /dev/ttyS1
            baud: 9600
            debug: 0
How a value is written decides what it becomes:
| YAML value | Point |
|---|---|
string (hello, "10") | text |
integer (10) | integer value |
float (1.5) | float value |
bool (true) | value 1 or 0 |
| null | a point with no value |
| mapping | one point per entry, the key becomes a point key |
| sequence | one point per element, keyed "0", "1", … |
Quoting is what tells a text value from a numeric one, which matters when a
value looks like a number: port: 502 is numeric and port: "502" is text. If
a client expects text and the file gives it a number, the client reads an empty
value, so quote anything that is really text.
A mapping under a point type is a set of keyed points, and a sequence is an array:
- metrics:
    metricSysCPUFreq:
      cpu0: 1400
      cpu1: 1600
    tag: [alpha, beta] # keys "0" and "1"
Three keys inside a node are reserved: parent, children, and edgePoints.
Every other key is a point type, id included – Modbus and OneWire nodes
configure a point named id, and it is written like any other point. A node’s
own ID never appears in a file.
Edge points, such as a user’s role, are spelled the same way under their own key:
- user:
    firstName: Admin
    email: admin@example.com
    edgePoints:
      role: admin
Points that a file does not need to carry are left out of an export. The
nodeType edge point is one of them, since the node type is the key each node
is written under, and the system fills it in when a file is applied.
How nodes are found
A file describes what the tree should look like rather than naming the nodes it means by ID, so applying one twice does what applying it once did. A node in a file matches an existing node when the parent and the description agree:
- No match: the node is created.
- A match of the same type: only the points whose values differ are sent.
- A match of a different type: an error, since a file that says
modbuswhere the tree holds agroupis either a mistake or a rename. - More than one match: an error, since nothing says which node was meant.
A user node has no description, so an email address identifies it, and a name if
there is no email. An entry with no description at all matches the single node
of its type, which is how a metrics or serial node is addressed.
A description is how a file finds a node. Renaming one in the UI detaches it from the file that describes it, and the next time that file is applied it creates a second node beside the renamed one. The same is true of renaming a node in a file. Renaming deliberately is a two step change: delete the old description in the same file that introduces the new one. Give nodes descriptions that are meant to last.
Where nodes attach
A top level entry with no parent is applied under this instance’s device node.
A parent names a node anywhere in the tree by description, which is how a file
adds to a subtree it did not create:
nodes:
  - group:
      description: Tank farm
  - variable:
      parent: Tank farm
      description: Tank level
Entries apply in the order they are written, so a parent naming a node the
same file creates has to come after the entry that creates it.
Referring to another node
A point of type nodeID names the node it refers to by description, and is
resolved the same way parent is:
nodes:
  - variable:
      description: Tank level
  - rule:
      description: Tank low
      children:
        - condition:
            description: Level below 10
            nodeID: Tank level
            operator: "<"
            value: 10
References resolve after the whole file has been read, so one may point at a node the file creates further down, or at a node another file created.
Removing nodes
Applying a file adds and updates; it never removes something for going
unmentioned. A delete list removes nodes, matched the way nodes entries are:
delete:
  - modbus:
      parent: Tank farm
      description: Old sensors
Deleting what is already gone does nothing, so a file with a delete list is as
safe to apply repeatedly as any other.
Configuration export
Nodes can be exported to a YAML file. This is useful to:
- Back up the current configuration
- Transfer a configuration, or part of one, from one instance to another
- Build a configuration in the UI and then ship it as a provisioning file
To look at an instance rather than reproduce it, use siot dump instead, which
is described below.
To export the entire tree:
siot export > backup.yaml
A subset of the tree can be exported by specifying the node ID:
siot export -nodeID 9d7c1c03-0908-4f8b-86d7-8e79184d441d > export.yaml
An export describes configuration and nothing else, which is what makes it usable as a provisioning file:
- The root node is left out. It is this instance rather than configuration, and a file describing it would match nothing anywhere else. Exporting the tree exports what is under the root.
- Node IDs are left out, since a file finds its nodes by description. A
nodeIDpoint is written as the description of the node it points at. - Points that carry no value are left out, as is the origin recording which client last wrote each point.
- Secret points (
authToken,enrollToken,pass,psk, andsid) are left out, and a comment at the top of the file says so.siot export -secretsincludes them, and a file made that way should be handled like the credentials themselves.
Two nodes that share a parent and a description cannot be told apart by a file,
so siot export reports that rather than writing a file that would do the wrong
thing when applied. Give those nodes distinct descriptions, which is worth doing
anyway.
Instance dump
siot dump describes an instance as it actually is. Export answers “what would
recreate this configuration”; dump answers “why is this instance behaving the
way it is”, so it reports the identifiers and structure export leaves out:
siot dump
- The instance root node ID, which is the identity this instance replicates under
- The tree with every node ID and type, including deleted nodes
- Every parent of each node, so a node that appears in more than one place says so
- An
anomaliessection listing any node other than the root that carries the virtualrootparent, which would give the instance a second root
Two flags add detail:
siot dump -pointsincludes every point with the origin that wrote it and the time it was written, which is what to compare when two instances disagree about a valuesiot dump -streamslists the boundary-origin replication streams and their message counts, which shows at a glance which instances this one replicates with
siot dump -all turns on both, and siot dump -nodeID <id> limits the tree to
one subtree.
Comparing the same dump from two instances is the quickest way to tell a replication problem from a configuration one. Instances that disagree about their root IDs, or that are missing a stream for each other, have a replication problem; instances that agree on structure but differ on a point’s origin or time have a configuration one.
Configuration import
siot import applies a file to a running instance, reading it from STDIN:
siot import < config.yaml
Nodes are matched by description, as described above, so importing a file creates what is missing, updates what has drifted, and does nothing when the tree already agrees. Importing the same file twice does what importing it once did.
siot import -dryRun < config.yaml prints what the file would do without
applying any of it.
If authentication or a different server is required, this can be specified through command line arguments or the following environment variables (see descriptions above):
SIOT_NATS_SERVERSIOT_AUTH_TOKEN
siot import --help for more details.
Example YAML file:
nodes:
  - group:
      description: group 1
      children:
        - variable:
            description: var 1
            value: 10
Configuration provisioning
An instance can be configured from files rather than by hand. Provisioning
applies the same files siot import does, and applies them at start-up and
whenever they change, so a unit built from an image comes up configured with no
import step and no operator involvement.
There are two places files come from:
- A directory on disk, given by
-provisioningDirorSIOT_PROVISIONING_DIR, defaulting to<SIOT_DATA>/provisioningwhen that directory exists. Files are applied in lexical order, so the familiar10-,20-prefixes express which file goes first. - Files uploaded through the UI, which are
filenodes under theprovisioningnode. This is how a unit whose filesystem you cannot reach gets configured.
Files on disk are applied first and uploads layer on top, so an uploaded file can attach to a group a shipped file created. Uploads are applied oldest first, by when the file was added rather than when its contents were last replaced, so correcting a file does not change its place in the order.
A file node exists from the moment it is added and its contents arrive when you upload them, so provisioning waits for the upload and leaves an empty file node alone.
A file is applied when its contents change, which is what leaves a value edited in the UI alone until the file describing it changes. A file that fails to parse or apply records its error and leaves the other files alone.
Checking files
siot provision -dir ./provisioning prints what the files in a directory would
do to a running instance without applying any of it.
siot provision -dir ./provisioning -check only parses them, which needs no
running instance and is what a build can use to fail on a bad file.
Seeing what happened
A provisioning node under the root records what was applied. Each file on disk
gets a provisioningFile child carrying its name, the checksum of what was
applied, and the last error if it failed. An uploaded file records the same
thing on the file node itself, so a file and its status are one node in the UI.
Removing a file from the directory removes its status. The nodes it created stay
where they are: provisioning describes what should exist, and does not own what
it made. Use a delete list to remove nodes.
Status
The Simple IoT project is still in a heavy development phase. Most of the core concepts are stable, but APIs, packet formats, and implementation will continue to change for some time yet. SIOT has been used in several production systems to date with good success, but be prepared to work with us (report issues, help fix bugs, etc.) if you want to use it now.
Handling of high rate sensor data
Currently each point change requires quite a bit computation to update the HASH values in upstream graph nodes. For repetitive data, this is not necessary as new values are continually coming in, so we will at some point make an option to specify points values as repetitive. This will allow SIOT to scale to more devices and higher rate data.
User Interface
The web UI holds one NATS connection over a WebSocket for the life of the session, fetches nodes as you expand the tree, and receives changes to the nodes on screen as they happen. See the UI page. Node operations (add, delete, move, mirror, duplicate) still go over HTTP.
Security
Currently, and device that has access to the system can write or write to any data in the system. This may be adequate for small or closed systems, but for larger systems, we need per-device authn/authz. See issue #268, PR #283, and our security document for more information.
Errata
Any issues we find during testing we log in GitHub issues, so if you encounter something unexpected, please search issues first. Feel free to add your observations and let us know if an issues is impacting you. Several issues to be aware of:
- We don’t handle loops in the graph tree yet. This will render the instance unusable and you’ll have to clean the database and start over.
Frequently Asked Questions
Q: How is SIOT different than Home Assistant, OpenHAB, Domoticz, etc.?
Although there may be some overlap and Simple IoT may eventually support a number of off the shelf consumer IoT devices, the genesis, and intent of the project is for developing IoT products and the infrastructure required to support them.
Q: How is SIOT different than Particle.io, etc.?
Particle.io provides excellent infrastructure to support their devices and solve many of the hard problems such as remote firmware update, getting data securely from device to cloud, and efficient data bandwidth usage. But, they don’t provide a way to provide a user facing portal for a product that customers can use to see data and interact with the device.
Q: What happens to data collected while a device is offline?
It is queued on the device and delivered when the connection returns. Every instance writes to its own local store first and replicates that store upstream, so an outage stops the transfer and not the collection. On reconnect, only the missed data is sent, in order and with the original timestamps. Configuration changed in the cloud while the device is away is delivered at the same time. See Synchronization for details and for the retention limits that determine how long a device can be offline and still catch up in full.
Q: How is SIOT different than AWS/Azure/GCP/… IoT?
SIOT is designed to be simple to develop and deploy without a lot of moving parts. We’ve reduced an IoT system to a few basic concepts that are exactly the same in the cloud and on edge devices. This symmetry is powerful and allows us to easily implement and move functionality wherever it is needed. If you need Google Scale, SIOT may not be the right choice; however, for smaller systems where you want a system that is easier to develop, deploy, and maintain, consider SIOT.
Q: Can’t NATS JetStream do everything SIOT does?
This is a good question and I’m not sure yet. NATS has some very interesting features like JetStream which can queue data and store data in a key-value store and data can be synchronized between instances. NATS also has a concept of leaf-nodes, which conceptually makes sense for edge/gateway connections. JetStream is optimized for data flowing in one direction (ex: orders through fulfillment). SIOT is optimized for data flowing in any direction and data is merged using data structures with CRDT (conflict-free replicated data types) properties. SIOT also stores data in a DAG (directed acyclic graph) which allows a node to be a child of multiple nodes, which is difficult to do in a hierarchical namespace. Additionally, each node is defined by an array of points and modifications to the system are communicated by transferring points. SIOT is a batteries included complete solution for IoT solutions, including a web framework, clients for various types of IO (ex: Modbus) and cloud services (ex: Twilio). We will continue to explore using more of NATS core functionality as we move forward.
Documentation
Good documentation is critical for any project and to get good documentation, the process to create it must be as frictionless as possible. With this in mind, we’ve structured SIOT documentation as follows:
- Markdown is the primary source format.
- Documentation lives in the same repo as the source code. When you update the code, update the documentation at the same time.
- Documentation is easily viewable in GitHub, or our generated docs site. This allows any snapshot of SIOT to contain a viewable snapshot of the documentation for that revision.
mdbookis used to generate the documentation site.- All diagrams are stored in a
single draw.io
file. This allows you to easily see what diagrams are available and easily
copy pieces from existing diagrams to make new ones. Then generate a PNG for
the diagram in the
images/directory in the relevant documentation directory.
Vision
This document attempts to outlines the project philosophy and core values. The basics are covered in the readme. As the name suggests, a core value of the project is simplicity. Thus, any changes should be made with this in mind. Although this project has already proven useful on several real-world project, it is a work in progress and will continue to improve. As we continue to explore and refine the project, many things are getting simpler and more flexible. This process takes time and effort.
“When you first start off trying to solve a problem, the first solutions you come up with are very complex, and most people stop there. But if you keep going, and live with the problem and peel more layers of the onion off, you can often times arrive at some very elegant and simple solutions.” - Steve Jobs
Guiding principles
- Simple concepts are flexible and scale well.
- IoT systems are inherently distributed, and distributed systems are hard.
- There are more problems to solve than people to solve them, thus it makes sense to collaborate on the common technology pieces.
- There are a lot of IoT applications that are not Google scale (10-1000 device range).
- There is significant opportunity in the long tail of IoT, which is our focus.
- There is value in custom solutions (programming vs drag-n-drop).
- There is value in running/owning our own platform.
- A single engineer should be able to build and deploy a custom IoT system.
- We don’t need to spend excessive amounts of time on operations. For smaller deployments, we deploy one binary to a cloud server and we are done with operations. We don’t need 20 microservices when one monolith will work just fine.
- For many applications, a couple of hours of down time is not the end of the world. Thus, a single server that can be quickly rebuilt as needed is adequate and in many cases more reliable than complex systems with many moving parts.
Technology choices
Choices for the technology stack emphasize simplicity, not only in the language, but just as important, in the deployment and tooling.
- Backend
- Go
- Simple language and deployment model
- Nice balance of safety + productivity
- Excellent tooling and build system
- See this thread for more discussion/information
- Go
- Frontend
- Single Page Application (SPA) architecture
- Fits well with real-time applications where data is changing all the time
- Easier to transition to Progressive Web Apps (PWA)
- Elm
- Nice balance of safety + productivity
- Excellent compiler messages
- Reduces possibility for run time exceptions in browser
- Does not require a huge/complicated/fragile build system typical in JavaScript frontends.
- excellent choice for SPAs
- elm-ui
- What if you never had to write CSS again?
- Fun, yet powerful way to lay out a user interface and allows you to efficiently make changes and get the layout you want.
- Single Page Application (SPA) architecture
- Database
- SQLite
- See Store
- Eventually support multiple database backends depending on scaling/admin needs
- SQLite
- Cloud Hosting
- Any machine that provides ability run long-lived Go applications
- Any MAC/Linux/Windows/rPI/Beaglebone/Odroid/etc. computer on your local network.
- Cloud VMs: Digital Ocean, Linode, GCP compute engine, AWS EC2, etc. Can easily host on a $5/mo instance.
- Edge Devices
- Any device that runs Linux (rPI, Beaglebone-black, industrial SBCs, your custom hardware …)
In our experience, simplicity and good tooling matter. It is easy to add features to a language, but creating a useful language/tooling that is simple is hard. Since we are using Elm on the frontend, it might seem appropriate to select a functional language like Elixir, Scala, Clojure, Haskell, etc. for the backend. These environments are likely excellent for many projects, but are also considerably more complex to work in. The programming style (procedural, functional, etc.) is important, but other factors such as simplicity/tooling/deployment are also important, especially for small teams who don’t have separate staff for backend/frontend/operations. Learning two simple languages (Go and Elm) is a small task compared to dealing with huge languages, fussy build tools, and complex deployment environments.
This is just a snapshot in time - there will likely be other better technology choices in the future. The backend and frontend are independent. If either needs to be swapped out for a better technology in the future, that is possible.
Architecture
This document describes how the Simple IoT project fulfills the basic requirements as described in the top level README.
There are two levels of architecture to consider:
- System: how multiple SIOT instances and other applications interact to form a system.
- Application: how the SIOT application is structured.
- Clients: all about SIOT clients where most functionality is implemented.
High Level Overview
Simple IoT functions as a collection of connected, distributed instances that communicate via NATS. Data in the system is represented by nodes which contain an array of points. Data changes are communicated by sending points within an instance or between instances. Points in a node are merged such that newer points replace older points. This allows granular modification of a node’s properties. Nodes are organized in a DAG (directed acyclic graph). This graph structure defines many properties of the system such as what data users have access to, the scope of rules and notifications, and which nodes external services apply to. Most functionality in the system is implemented in clients, which subscribe and publish point changes for nodes they are interested in.
System Architecture
Contents
IoT Systems are distributed systems
IoT systems are inherently distributed where data needs to be synchronized between a number of different systems including:
- Cloud (one to several instances depending on the level of reliability desired)
- Edge devices (many instances)
- User Interface (phone, browser)
Typically, the cloud instance stores all the system data, and the edge, browser, and mobile devices access a subset of the system data.
Extensible architecture
Any siot app can function as a standalone, client, server or both. As an
example, siot can function both as an edge (client) and cloud apps (server).
- Full client: full SIOT node that initiates and maintains connection with another SIOT instance on a server. Can be behind a firewall, NAT, etc.
- Server: needs to be on a network that is accessible by clients
We also need the concept of a lean client where an effort is made to minimize the application size to facilitate updates over IoT cellular networks where data is expensive.
Device communication and messaging
In an IoT system, data from sensors is continually streaming, so we need some type of messaging system to transfer the data between various instances in the system. This project uses NATS.io for messaging. Some reasons:
- Allows us to push real-time data to an edge device behind a NAT, on cellular network, etc. - no public IP address, VPN, etc. required.
- Is more efficient than HTTP as it shares one persistent TCP connection for all messages. The overhead and architecture is similar to MQTT, which is proven to be a good IoT solution. It may also use less resources than something like observing resources in CoAP systems, where each observation requires a separate persistent connection.
- Can scale out with multiple servers to provide redundancy or more capacity.
- Is written in Go, so possible to embed the server to make deployments simpler for small systems. Also, Go services are easy to manage as there are no dependencies.
- Focus on simplicity - values fit this project.
- Good security model.
For systems that only need to send one value several times a day, CoAP is probably a better solution than NATS. Initially we are focusing on systems that send more data - perhaps 5-30MB/month. There is no reason we can’t support CoAP as well in the future.
Data modification
Where possible, modifying data (especially nodes) should be initiated over NATS vs direct db calls. This ensures anything in the system can have visibility into data changes. Eventually we may want to hide db operations that do writes to force them to be initiated through a NATS message.
Simple, Flexible data structures
As we work on IoT systems, data structures (types) tend to emerge. Common data structures allow us to develop common algorithms and mechanism to process data. Instead of defining a new datatype for each type of sensor, define one type that will work with all sensors. Then the storage (both static and time-series), synchronization, charting, and rule logic can stay the same and adding functionality to the system typically only involves changing the edge application and the frontend UI. Everything between these two end points can stay the same. This is a very powerful and flexible model as it is trivial to support new sensors and applications.
See Data for more information.
Node Tree
The same Simple IoT application can run in both the cloud and device instances. The node tree in a device would then become a subset of the nodes in the cloud instance. Changes can be made to nodes in either the cloud or device and data is synchronized in both directions.
The following diagram illustrates how nodes might be arranged in a typical system.
A few notes this structure of data:
- A user has access to its child nodes, parent nodes, and parent node descendants (parents, children, siblings, nieces/nephews).
- Likewise, a rule node processes points from nodes using the same relationships described above.
- A user can be added to any node. This allows permissions to be granted at any level in the system.
- A user can be added to multiple nodes.
- A node admin user can configure nodes under it. This allows a service provider to configure the system for their own customers.
- If a point changes, it triggers rules of upstream nodes to run (perhaps paced to some reasonable interval)
- The Edge Dev Offline rule will fire if any of the Edge devices go offline. This allows us to only write this rule once to cover many devices.
- When a rule triggers a notification, the rule node and any upstream nodes can optionally notify its users.
The distributed parts of the system include the following instances:
- Cloud (could be multiple for redundancy). The cloud instances would typically store and synchronize the root node and everything under it.
- Edge Devices (typically many instances (1000’s) connected via low bandwidth cellular data). Edge instances would store and synchronize the edge node instance and descendants (ex Edge Device 1)
- Web UI (potentially dozens of instances connected via higher bandwidth browser connection).
As this is a distributed system where nodes may be created on any number of connected systems, node IDs need to be unique. A unique serial number or UUID is recommended.
Application Architecture
Contents
The Simple IoT Go application is a single binary with embedded assets. The database and NATS server are also embedded by default for easy deployment. There are five main parts to a Simple IoT application:
- NATS Message Bus: all data goes through this making it very easy to observe the system.
- Store: persists the data for the system in JetStream streams, merges incoming data, and replicates streams for synchronization with other instances.
- Clients: interact with other devices/systems such as Modbus, 1-wire, etc. This is where most of the functionality in a SIOT system lives, and where you add your custom functionality. Clients can exist inside the Simple IoT application or as external processes written in any language that connect via NATS. Clients are represented by a node (and optionally child nodes) in the SIOT store. When a node is updated, its respective clients are updated with the new information. Likewise, when a client has new information, it sends that out to be stored and used by other nodes/instances as needed.
- HTTP API: provides a way for HTTP clients to interact with the system.
- Web UI: Provides a user interface for users to interact with the system. Currently it uses the HTTP API, but will eventually connect directly to NATS.
The simplicity of this architecture makes it easy to extend with new functionality by writing a new client. Following the constraints of storing data as nodes and points ensures all data is visible and readable by other clients, as well as being automatically synchronized to upstream instances.
Application Lifecycle
Simple IoT uses the
Run()/Stop()
pattern for any long running processes. With any long running process, it is
important to not only Start it, but also to be able to cleanly Stop it. This is
important for testing, but is also good practice. Nothing runs forever so we
should never operate under this illusion. The
oklog/run packaged is used to start and
shutdown these processes concurrently. Dependencies between processes should be
minimized where possible through retries. If there are hard dependencies, these
can be managed with WaitStart()/WaitStop() functions. See
server.go
for an example.
NATS lends itself very well to a decoupled application architecture because the NATS clients will buffer messages for some time until the server is available. Thus, we can start all the processes that use a NATS client without waiting for the server to be available first.
Long term, a NATS API that indicates the status of various parts (rules engine, etc.) of the system would be beneficial. If there are dependencies between processes, this can be managed inside the process instead of in the code that starts/stops the processes.
Provisioning
Almost everything in Simple IoT is configured by nodes in the tree, and is
implemented as a client. Provisioning is not, because it has to work before
there is any configuration in the tree to read. It is a server level concern,
set by a command line flag and an environment variable and started in
server.Run() alongside the store and the client manager. This is the same
reasoning behind Grafana configuring provisioning in grafana.ini rather than
in the database it populates.
Provisioning applies the same files siot import does, using the engine in
client/apply.go, so a file works the same whichever way it is applied. See
user/configuration.
NATS Integration
The NATS API details the NATS subjects used by the system.
Echo concerns
Any time you potentially have two sources modifying the same resource (a node), you need to be concerned with echoed messages. This is a common occurrence in Simple IoT. Because another resource may modify a node, typically a client needs to subscribe to the node messages as well. This means when it sends a message, it will typically be echoed back. See the client documentation for ideas on how to handle the echo problem.
The
server.NewServer
function returns a NATS connection. This connection is used throughout the
application and does not have the NoEcho option set.
User Interface
Currently, the User Interface is implemented using a Single Page Architecture (SPA) Web Application. This keeps the backend and frontend implementations mostly independent. See User Interface and Frontend for more information.
There are many web architectures to chose from and web technology is advancing at a rapid pace. SPAs are not in vogue right now and more complex architectures are promoted such as Next.js, SveltKit, Deno Fresh, etc. Concerns with SPAs include large initial load and stability (if frontend code crashes, everything quits working). These concerns are valid if using JavaScript, but with Elm these concerns are minimal as Elm compiles to very small bundles, and run time exceptions are extremely rare. This allows us to use a simple web architecture with minimal coupling to the backend and minimal build complexity. And it will be a long time until we write enough Elm code that bundle size matters.
A decoupled SPA UI architecture is also very natural in Simple IoT, as IoT systems are inherently distributed. The frontend is just another client, much the same as a separate machine learning process, a downstream instance, a scripting process, etc.
Simple IoT Clients
Contents
Most functionality in Simple IoT is implemented in Clients.
Each client can be configured by one or more nodes in the SIOT store graph. These nodes may be created by a user, a process that detects new plug and play hardware, or other clients.
A client interacts with the system by listening for new points it is interested in and sending out points as it acquires new data.
Creating new clients
See Development for information on how to set up a development system.
Simple IoT provides utilities that assist in creating new clients. See the Go package documentation for more information. A client manager is created for each client type. This manager instantiates new client instances when new nodes are detected and then sends point updates to the client. Two levels of nodes are currently supported for client configuration. An example of this would be a Rule node that has Condition and Action child nodes.
A “disabled” option is useful and should be considered for every new client.
Creating a new client typically requires the following steps:
- Add any new node and points types to
schema.go,Node.elm, andPoint.elm. Please try to reuse existing point types when possible. - Create a new client in
client/directory. A client is defined by a type that satisfies theClient interface. A constructor must also be defined that is passed toNewManagerand a struct that represents the client data. The name of the struct must match the node type - for instance a node of typecanBusneeds to be defined by a struct namedCanBus. Additionally, each field of the client struct must have point tags. This allows us to automatically create and modify client structs from arrays of node points. - Create a new manager for the client in
client/client.go - Create an Elm UI for the client in
frontend/src/Components/ - Create plumbing for new
NodeXYZinfrontend/src/Pages/Home_.elm. Note, this can likely be improved a lot.
It is easiest to copy one of the existing clients to start. The NTP client is relatively simple and may be a good example.
Where a client runs
A node can sit in more than one place in the tree, and a client is started for
each place the node is found. That is right for a node whose behavior comes from
where it sits (a db client records the subtree under its parent, a user
carries a role in each group), and wrong for a node that owns something outside
the tree, where two clients would drive one bus or one line with no way to
coordinate.
So the edge carries a role. A client runs on a node’s primary edge and on edges with no role, and never on a mirror. This is handled by the client manager, so a client does not check anything itself.
When you add a client, decide which side its node type belongs on and add it to
primaryTypes or treeScopedTypes in data/edge_role.go. The question to ask
is whether two instances of the client would do the same work twice or different
work: a GPIO line requested twice is a conflict, while a db node under two
groups records two different subtrees. A test fails when a node type is in
neither group, so this is not something that can be forgotten. See
Primary and mirror edges.
Client life-cycle
It is important the clients cleanly implement the Run()/Stop() pattern and shut down cleanly when Stop() is called releasing all resources. If nodes are added or removed, clients are started/stopped. Additionally, if a child node of a client config is added or removed, the entire client is stopped and then restarted. This relieves the burden on the client from managing the addition/removal of client functionality. Thus, it is very important that clients stop cleanly and release resources in case they are restarted.
Message echo
Clients need to be aware of the “echo” problem as they typically subscribe as
well as publish to the points subject for the nodes they manage. When they
publish to these subjects, these messages will be echoed back to them. There are
several solutions:
- Create a new NATS connection for the client with the
NoEchooption set. For this to work, each client will need to establish its own connection to the server. This may not work in cases where subjects are aliased into authenticated subject namespaces. - Inspect the
PointOriginfield - if is blank, then it was generated by the node that owns the point and does not need to be processed by the client generating the data for that node. If is not blank, then the Point was generated by a user, rule, or something other than the client owning the node and must be processed. This may not always work - example: user is connected to a downstream instance and modifies a point that then propagates upstream- it may get echoed back to an authenticated client.
- (investigation stage) A NATS messages header can be populated with the ID of the client that sent the message. If it is an authenticated client, then the message will not be echoed on the authenticated client subject namespace of the same ID. This information is not stored, so cannot be used for auditing purposes.
The SIOT client manager filters out points for the following two scenarios:
- A point with the same ID as the client and Origin set to a blank string.
- A point received for a client where Origin matches the client root node ID.
Thus, if you want to set a point in one client and get that point to another node client, you must set the Origin field. This helps ensure that the Origin field is used consistently as otherwise stuff won’t work.
This gets a little tricky for clients that manage a node and its children (for instance the rule client - it has condition and action child nodes). If we follow the following rule:
Clients must set the point Origin field for any point sent to anything other than its root node.
If we following the above rule, then things should work. We may eventually provide clients with a function to send points that handles this automatically, but for now it is manual.
See also tracking who made changes.
Development
Go Package Documentation
The Simple IoT source code is available on GitHub.
Simple IoT is written in Go. Go package documentation is available.
Building Simple IoT
Requirements:
- Go, at least the version named by the
godirective ingo.mod. A newer Go downloads it automatically. Releases and CI build with that same version, so bump it ingo.moddeliberately, together with thegolangci-lintpin in.github/workflows/go.ymlwhen the minor version changes. - Node/NPM
Simple IoT build has currently been testing on Linux and MacOS systems. See
envsetup.sh
for scripts used in building.
To build:
source envsetup.shsiot_setupsiot_build
Developing Simple IoT
npm install -g run-pty. envsetup.shsiot_setupsiot_watch
The siot_watch command can be used when developing Simple IoT. This does the
following:
- Starts
elm-watchon the Elm code.elm-watchwill automatically update the UI without losing state any time an Elm file changes. - Runs the Go backend and rebuilds it anytime a Go module changes (only tested on Linux and MacOS, but should be easy to set up Windows as well)
Both of the above are run in a run-pty
wrapper, which allows you to see the output of either process. The output of the
Elm compile is displayed in the browser, so it is rarely necessary to view the
elm-watch side.
Using Simple IoT as a library
Simple IoT can be used a library for your custom application. The SIOT main.go illustrates how to start the SIOT server, and add clients. You can do this from any Go application. With a few lines of code, this gives you a lot of functionality including a NATS server.
Developing a new SIOT client
Most SIOT functionality is implemented in clients. See the client documentation for more information.
Customizing the UI
Currently, there is no simple way to customize the SIOT UI when using SIOT as a library package. Forking and changing the SIOT Elm code is probably the simplest way if you want to make a small change now.
In the future, we plan to provide an API for passing in a custom UI to the SIOT Server. You can also implement a custom HTTP client that serves up a custom UI.
Code Organization
Currently, there are a lot of subdirectories. One reason for this is to limit
the size of application binaries when building edge/embedded Linux binaries. In
some use cases, we want to deploy app updates over cellular networks, therefore
we want to keep packages as small as possible. For instance, if we put the
natsserver stuff in the nats package, then app binaries grow a couple MB,
even if you don’t start a NATS server. It is not clear yet what Go does for dead
code elimination, but at this point, it seems referencing a package increases
the binary size, even if you don’t use anything in it. (Clarification welcome!)
For edge applications on Embedded Linux, we’d eventually like to get rid of net/HTTP, since we can do all network communications over NATS. We’re not there yet, but be careful about pulling in dependencies that require net/HTTP into the NATS package, and other low level packages intended for use on devices.
Directories
See Go docs directory descriptions
Coding Standards
Please run siot_test from envsetup.sh before submitting pull requests. All
code should be formatted and linted before committing.
Please configure your editor to run code formatters:
- Go:
goimports - Elm:
elm-format - Markdown:
prettier(note, there is a.prettierrcin this project that configures prettier to wrap markdown to 80 characters. Whether to wrap markdown or not is debatable, as wrapping can make diffs harder to read, but Markdown is much more pleasant to read in an editor if it is wrapped. Since more people will be reading documentation than reviewing, let’s optimize for the reading in all scenarios - editor, GitHub, and generated docs)
Pure Go
We plan to keep the main Simple IoT application a pure Go binary if possible. Statically linked pure Go has huge advantages:
- You can easily cross compile to any target from any build machine.
- Blazing fast compile times
- Deployment is dead simple – zero dependencies. Docker is not needed.
- You are not vulnerable to security issues in the host systems SSL/TLS libraries. What you deploy is pretty much what you get.
- Although there is high quality code written in C/C++, it is much easier to write safe, reliable programs in Go. Long term there is much less risk using a Go implementation of about anything – especially if it is widely used.
- Go’s network programming model is much simpler than about anything else. Simplicity == less bugs.
Once you link to C libraries in your Go program, you forgo many of the benefits of Go. The Go authors made a brilliant choice when they chose to build Go from the ground up. Yes, you loose the ability to easily use some of the popular C libraries, but what you gain is many times more valuable.
Running unit tests
There are not a lot of unit tests in the project yet, but below are some examples of running tests:
- test everything:
go test -race ./... - test only client directory:
go test -race ./client - Run only a specific:
go test -race ./client -run BackoffTest(run takes a RegEx) siot_testruns tests as well as vet/lint, frontend tests, etc.
The leading ./ is important, otherwise Go things you are giving it a package
name, not a directory. The ... tells Go to recursively test all sub
directories.
Document and test during development
It is much more pleasant to write documentation and tests as you develop, rather than after the fact. These efforts add value to your development if done concurrently. Quality needs to be designed-in, and leading with documentation will result in better thinking and a better product.
If you develop a feature, please update/create any needed documentation and write any tests (especially end-to-end) to verify the feature works and continues to work.
Data
Contents
See also:
Data Structures
As a client developer, there are two main primary structures:
NodeEdge
and Point. A
Node can be considered a collection of Points.
These data structures describe most data that is stored and transferred in a Simple IoT system.
The core data structures are currently defined in the
data directory for
Go code, and
frontend/src/Api
directory for Elm code.
A Point can represent a sensor value, or a configuration parameter for the
node. With sensor values and configuration represented as Points, it becomes
easy to use both sensor data and configuration in rule or equations because the
mechanism to use both is the same. Additionally, if all Point changes are
recorded in a time series database (for instance InfluxDB), you automatically
have a record of all configuration and sensor changes for a node.
Treating most data as Points also has another benefit in that we can easily
simulate a device. Provide an UI or write a program to modify any point and we
can shift from working on real data to simulating scenarios we want to test.
Edges are used to describe the relationships between nodes as a directed acyclic graph.
Nodes can have parents or children and thus be represented in a hierarchy. To
add structure to the system, you simply add nested Nodes. The Node hierarchy
can represent the physical structure of the system, or it could also contain
virtual Nodes. These virtual nodes could contain logic to process data from
sensors. Several examples of virtual nodes:
- A pump
Nodethat converts motor current readings into pump events. - Implement moving averages, scaling, etc. on sensor data.
- Combine data from multiple sensors
- Implement custom logic for a particular application
- A component in an edge device such as a cellular modem
Like Nodes, Edges also contain a Point array that further describes the relationship between Nodes. Some examples:
- Role the user plays in the node (viewer, admin, etc.)
- Order of notifications when sequencing notifications through a node’s users
- Node is enabled/disabled for instance we may want to disable a Modbus IO node that is not currently functioning.
Being able to arranged nodes in an arbitrary hierarchy also opens up some interesting possibilities such as creating virtual nodes that have a number of children that are collecting data. The parent virtual nodes could have rules or logic that operate off data from child nodes. In this case, the virtual parent nodes might be a town or city, service provider, etc., and the child nodes are physical edge nodes collecting data, users, etc.
The Point Key field constraint
The Point data structure has a Key field that can be used to construct Array
and Map data structures in a node. This is a flexible idea in that it is easy to
transition from a scaler value to an array or map. However, it can also cause
problems if one client is writing key values of "" and another client (say a
rule action) is writing value of "0". One solution is to have fancy logic that
equates "" to "0" on point updates, compares, etc. Another approach is to
consider "" and invalid key value and set key to "0" for scaler values. This
incurs a slight amount of overhead, but leads to more predictable operation and
eliminates the possibility of having two points in a node that mean the same
things.
The Simple IoT Store always sets the Key field to "0" on incoming points if
the Key field is blank.
Clients should be written with this in mind.
The Point Type and Key character constraint
A point travels on a NATS subject that ends in its type and key, so both are
subject tokens and may not contain a period, whitespace, or the NATS wildcards
* and >. Listeners read the node ID and parent ID from fixed positions in a
subject, so a period would add a token, shift everything after it, and deliver
the point to the wrong handler.
The store rejects points it cannot publish rather than rewriting them, since a
key is data the sender chose and often the name it writes back to. A rejected
point is logged with its type and key, and an error point is set on the node
so the sender is visible in the UI.
A client that builds keys from names it does not control – kernel device names,
mount points, network interface names – should pass them through
data.SubjectSafeToken,
which replaces the offending characters with underscores. The metrics client
does this for sensor and interface names, which is why a cooling device the
kernel calls devfreq-17000000.gpu appears as devfreq-17000000_gpu.
The number of points on a node
A node and all of its points are encoded into a single NATS message when the node is requested, so a node cannot hold an unbounded number of points. A typical point encodes to about 34 bytes and one with a long type and a multi-label key to about 100, against a 1 MB message limit, so a node reaches it somewhere around 10,000 points.
A client that can generate points in bulk — one reading per device, per process, or per scraped metric — should bound how many it publishes to a single node, and should split a large source across several nodes rather than growing one. The failure is worse than it sounds: a reply carries a subtree, so a node too large to encode fails every tree fetch that covers it, not only itself. See Message and payload limits for the symptoms and for how to recover a node that has already grown too large.
Converting Nodes to other data structures
Nodes and Points are convenient for storage and synchronization, but cumbersome
to work with in application code that uses the data, so we typically convert
them to another data structure.
data.Decode,
data.Encode,
and
data.MergePoints
can be used to convert Node data structures to your own custom struct, much
like the Go json package.
Arrays and Maps
Points can be used to represent arrays and maps. For an array, the key field
contains the index "0", "1", "2", etc. For maps, the key field contains
the key of the map. An example:
| Type | Key | Data (string) | Data (number) |
|---|---|---|---|
| description | 0 | Node Description | |
| ipAddress | 0 | 192.168.1.10 | |
| ipAddress | 1 | 10.0.0.3 | |
| diskPercentUsed | / | 43 | |
| diskPercentUsed | /home | 75 | |
| switch | 0 | 1 | |
| switch | 1 | 0 |
The above would map to the following Go type:
type myNode struct {
    ID              string      `node:"id"`
    Parent          string      `node:"parent"`
    Description     string      `node:"description"`
    IpAddresses     []string    `point:"ipAddress"`
    Switches        []bool      `point:"switch"`
    DiscPercentUsed []float64   `point:"diskPercentUsed"`
}
The
data.Decode()
function can be used to decode an array of points into the above type. The
data.Merge()
function can be used to update an existing struct from a new point.
Best practices for working with arrays
To make changes to an array in UI/Client code when storing the array in a native structure, store a length field as well so you know how long the original array was. After modifying the array, check if the new length is less than the original - if it is, then add a tombstone points to the end so that the deleted points get removed.
Generally it is simplest to send the entire array as a single message any time
any value in it has changed - especially if values are going to be added or
removed. The data.Decode will then correctly handle the array resizing.
Technical details of how data.Decode works with slices
Some consideration is needed when using Decode and MergePoints to decode
points into Go slices. Slices are never allocated / copied unless they are being
expanded. Instead, deleted points are written to the slice as the zero value.
However, for a given Decode call, if points are deleted from the end of the
slice, Decode will re-slice it to remove those values from the slice. Thus,
there is an important consideration for clients: if they wish to rely on slices
being truncated when points are deleted, points must be batched in order such
that Decode sees the trailing deleted points first. Put another way, Decode
does not care about points deleted from prior calls to Decode, so “holes” of
zero values may still appear at the end of a slice under certain circumstances.
Consider points with integer values [0, 1, 2, 3, 4]. If tombstone is set on
point with Key 3 followed by a point tombstone set on point with Key 4,
the resulting slice will be [0, 1, 2] if these points are batched together.
But, if they are sent separately (thus resulting in multiple Decode calls),
the resulting slice will be [0, 1, 2, 0].
Node Topology changes
Nodes can exist in multiple locations in the tree. This allows us to do things like include a user in multiple groups.
Add
Node additions are detected in real-time by sending the points for the new node as well as points for the edge node that adds the node to the tree.
Copy
Node copies are similar to add, but only the edge points are sent. A copy of a node that has a primary location is marked a mirror; see Primary and mirror edges below.
Delete
Node deletions are recorded by setting a tombstone point in the edge above the node to true. If a node is deleted, this information needs to be recorded, otherwise the synchronization process will simply re-create the deleted node if it exists on another instance.
Deleting the primary edge of a node also deletes its mirrors, because a mirror of a deleted node has nothing behind it.
Move
Move is just a combination of Copy and Delete. The role of the edge is carried across, so a moved node keeps the place it had. Some node types are found by walking down from their parent rather than from the tree root, and those cannot be moved out from under it (see below).
If the any real-time data is lost in any of the above operations, the catch up synchronization will propagate any node changes.
Primary and mirror edges
A node reached through two parents is one node with one set of points, and for most node types that is the point of mirroring: a user belongs to two groups, a rule is visible from two places. For a node that owns something outside the tree (a Modbus bus, a GPIO line, an MQTT broker connection), it is not. Two clients acting on one piece of hardware, possibly from two instances, have no way to coordinate.
The edge says which is which, through two edge points:
| Edge points | Role | Meaning |
|---|---|---|
primary = 1 | primary | the node in the place it lives; its client runs here |
mirror = 1 | mirror | a view of the node for organization and access control; no client runs here |
| neither | no role | a node with no primary location; every edge runs a client |
Read the role through
NodeEdge.EdgeRole
rather than the points directly. An edge carrying both points reads as a mirror,
because declining to run a client is the safe direction to fail.
Which node types have a primary location
A node type is primary when its client’s behavior comes from a resource it holds
rather than from where the node sits: modbus, modbusIo, oneWire,
oneWireIO, shelly, shellyIo, gpio, gps, serialDev, canBus,
particle, networkManager and its children, ntp, browser, update,
provisioning, provisioningFile, sync, metrics, signalGenerator,
mqtt, mqttSub, and the mqttDevice and Sparkplug nodes an MQTT connection
builds from the topics it sees.
The rest take their meaning from where they sit, so several instances are
meaningful and each one runs a client: device, user, group, rule,
condition, action, actionInactive, variable, db, msgService, and
file. A db client records the subtree under its parent and a msgService
client sees notifications raised under its parent, so mirroring one into a
second group gives a second client doing a different and correct job.
A custom node type the system does not know carries no role and behaves as node types always have.
The two groups are primaryTypes and treeScopedTypes in
data/edge_role.go.
Both are listed explicitly, and a test fails when a node type is in neither, so
adding a client means deciding which side its node type belongs on.
Nodes that belong under a particular parent
Separately from the primary role, some node types are found by walking down from
their parent: a modbusIo through its modbus bus, a condition through its
rule. Moving one of these elsewhere leaves it where nothing looks for it, so
the move is refused and mirroring is offered instead. data.NodeTypeOwner holds
the table.
Across sync boundaries
Mirroring a node from a device subtree into a group on an upstream instance is the case this mechanism was built for, and the roles are set correctly when it happens: the device keeps the primary edge, the upstream group gets a mirror, and only the device runs a client. Access works the same way, since a mirror edge grants a user reach to the node exactly as any other edge does.
Control works through the mirror as well. A valueSet written on the mirror –
by a rule on the upstream, or someone pressing a button in the portal UI –
reaches the device, and the client there acts on it and reports the result back
as value. Nothing about the write is special: the mirror and the primary are
the same node, so a point written on either lands on the node itself.
What makes this work is that ownership follows the primary edge.
EdgeCache.OwningBoundary walks up from a node to find the boundary that owns
it, and it skips mirror edges. A device replicates only the streams for its own
boundary, so if a mirror on the upstream moved the node’s ownership to the
upstream root, points the upstream wrote would be stored where the device never
reads them and a command would never arrive. Skipping mirror edges keeps the
node with the device that holds the hardware, which is where the client that
acts on it runs.
A node with no role works the same way without any marking. Every node hangs off the instance root, so reaching the root alongside a device boundary says only that the node is somewhere in this instance’s tree, and the device boundary is the one that says where the node lives. A variable on a device that is also mirrored onto the upstream therefore stays owned by the device, and a value written on the upstream reaches it.
A node reaches every device it is mirrored into
A node belongs to one boundary, and a device replicates only the streams for its
own boundary. That decides where the upstream stores the node and which instance
runs its client. Which devices receive the node is a separate question,
answered by walking every live edge above it, mirror or not, to the first device
boundary on each path. This is the node’s delivery set
(EdgeCache.DeliveryBoundaries). When the upstream writes a point to a node, it
appends the point to its own stream for the owning boundary as before, and also
to the stream it writes for each device in the delivery set. Each device pulls
its own stream, so all of them receive the write.
A variable under the upstream root mirrored into three devices reaches all three, and a setpoint changed in the portal arrives on each. Removing one mirror removes the node from that device only; the upstream purges the node’s copies from that device’s stream. Adding a mirror delivers the node’s current values right away, so a device never shows an empty node waiting for the next write.
Ownership follows the same rules as before. Mirroring a node whose type has no primary location (a variable, a rule, a group) makes an edge with no role, so a variable that lived on one device and is mirrored into a second resolves to the upstream root, and its stored subjects move there. The move does not affect delivery: both devices are in the delivery set, and both keep receiving the upstream’s writes.
What a device writes reaches the upstream and stops there. A write lands in the device’s own stream, which the upstream replicates and the other devices do not. Two devices sharing a variable each see the upstream’s writes and their own; a change made on one is visible on the upstream but not on the other. The same holds for a sensor on one device mirrored into another: the second device gets the edge and the values the upstream has copied for it, and readings the sensor’s device writes afterward do not reach it. Carrying device writes across would make the upstream a relay between devices, which is tracked in issue 810.
Behind this is the property that makes synchronization echo-free: only the origin instance ever appends to a stream. The upstream copies its own writes into several of its own streams, which keeps that property intact.
Upgrading
Edges created before this mechanism existed carry no role, so they keep running clients as they always have, including mirrors of hardware nodes. Which of several existing edges was meant to be the primary cannot be told after the fact, so nothing is guessed at for edges that are already there.
Mirroring one of these nodes does mark it, because the mirror is a new edge and the edge it is made from is where the node already lived: for a node type with a primary location, the source edge becomes the primary and the new edge a mirror. A mirror made before the upgrade carries no role, so remove it and mirror again to have both edges marked.
Tracking who made changes
The Point type has an Origin field that is used to track who generated this
point. If the node that owned the point generated the point, then Origin can be
left blank - this saves data bandwidth - especially for sensor data which is
generated by the client managing the node. There are several reasons for the
Origin field:
- Track who made changes for auditing and debugging purposes. If a rule or some process other than the owning node modifies a point, the Origin should always be populated. Tests that generate points should generally set the origin to “test”.
- Eliminate echos where a client may be subscribed to a subject as well as publish to the same subject. With the Origin field, the client can determine if it was the author of a point it receives, and if so simply drop it. See client documentation for more discussion of the echo topic.
Evolvability
One important consideration in data design is the can the system be easily changed. With a distributed system, you may have different versions of the software running at the same time using the same data. One version may use/store additional information that the other does not. In this case, it is very important that the other version does not delete this data, as could easily happen if you decode data into a type, and then re-encode and store it.
With the Node/Point system, we don’t have to worry about this issue because Nodes are only updated by sending Points. It is not possible to delete a Node Point. So it one version writes a Point the other is not using, it will be transferred, stored, synchronized, etc. and simply ignored by version that don’t use this point. This is another case where SIOT solves a hard problem that typically requires quite a bit of care and effort.
Simple IoT Store
Simple IoT stores all application data in NATS JetStream, using the NATS server that is already embedded in every SIOT instance. There is no separate database: the same technology that moves messages between components also persists them, retains their history, and (see Data Synchronization) replicates them between instances.
ADR-7 records the full analysis behind this
design. Earlier versions of SIOT used SQLite; existing SQLite data can be
migrated with siot export / siot import.
Why JetStream
A JetStream stream is an append-only, persistent log of messages with sequence numbers and per-subject indexing. That shape matches IoT data unusually well:
- Points are already messages. SIOT components communicate by publishing points over NATS. Persisting them is a matter of capturing the same messages in a stream, not translating them into a second data model.
- History is the natural byproduct. A stream retains every point written to a subject, so time-series history is stored in the same place as current state, rather than requiring a separate time-series database.
- Sequence numbers replace the hash tree. Streams are ordered and sequence-tracked, so another instance can replicate one and know exactly what it has and has not seen. This is the foundation of the synchronization design.
- Small and embedded. JetStream runs inside the NATS server SIOT already ships, on cloud instances and small edge devices alike.
Boundaries and streams
Streams are created per boundary, not per node. A boundary is a node that represents a SIOT instance:
- the local instance’s root node, and
- any device-type node, which corresponds to a (potentially synced) remote instance.
Every node is owned by the nearest boundary found walking up the tree through undeleted edges, skipping mirror edges. A node reachable from the instance root and one device boundary belongs to the device, since every node hangs off the root and only the device boundary says where the node lives. A node reachable from no boundary, or from two device boundaries, is owned by the instance root boundary. Boundaries align with the natural units of synchronization and authorization: a device’s subtree syncs as a unit, and permissions are typically granted at device or group level.
Each (boundary, origin instance) pair gets one stream:
inst_<boundaryID>_<originID>
where originID is the root node ID of the instance that writes the stream. The
inst (instance) prefix keeps the word “node” reserved for nodes in the data
tree — both stream tokens identify instances, since a boundary is a node that
represents one. Only the origin instance ever appends to its stream — this
single-writer property is what makes synchronization simple and echo-free. A
standalone instance with root R has a single stream, inst_R_R, holding its
entire tree.
A hub R with a synced device X sees three streams:
| Stream | Written by | Contains |
|---|---|---|
inst_R_R | hub | the hub’s own tree, including the edge to X |
inst_X_R | hub | configuration the hub writes into X’s subtree |
inst_X_X | device | everything the device writes (a replica on the hub) |
Subjects
Two subject spaces are in play. Wire subjects are how points move between components in real time — they are plain NATS, not stored:
| Subject | Purpose |
|---|---|
p.<nodeID>.<type>.<key> | node point |
ep.<nodeID>.<parentID> | edge points (batched) |
up.<upID>.<nodeID>.<type>.<key> | point fan-out up the tree |
up.<upID>.<nodeID>.<parentID>.<type>.<key> | edge point fan-out |
Listeners tell the two fan-out subjects apart by counting tokens, so a point
type or key may not contain a period. The store checks this on every point it
accepts — see checkPoints in store/store.go and
the data reference.
Storage subjects are what streams capture. They carry both routing tokens so stream subject spaces never overlap:
| Subject | Purpose |
|---|---|
inst.<boundaryID>.<originID>.<nodeID>.p.<type>.<key> | node point |
inst.<boundaryID>.<originID>.<parentID>.ep.<childID> | edge points |
The stream inst_<b>_<o> captures inst.<b>.<o>.>. Edges are stored with the
parent node’s boundary, so the edge attaching a device into a hub’s tree
lives in the hub’s stream — the device never needs it.
Current state: merge of subject tips
The current value of a point is the tip (last message) of its storage
subject. Because a boundary can have streams from several origins (the device’s
own data plus hub-written configuration), current state is the merge of tips
across all inst_<boundaryID>_* streams, under one rule:
- The newest point timestamp wins (timestamps are embedded in the point, not taken from the stream).
- Equal timestamps from different origins resolve to the lexically greater origin ID, so every instance converges on the same winner.
- An identical (timestamp, origin) delivery is a no-op, which makes the merge idempotent when the same point arrives more than once.
The store holds this merged state in two in-memory caches — an edge cache (the tree) and a point cache (current points) — populated by reading every stream’s subject tips at startup. The caches are the read path; queries never touch JetStream. Writes check the cache tip first, append to the stream, then update the cache, with a load-on-miss backstop.
Writes, deletes, and moves
A local write routes to inst_<owningBoundary>_<self>. Deleting a node writes a
tombstone point on its parent edge — history is preserved and the delete can be
undone. Moving a node (or subtree) across boundaries republishes its subject
tips into the new boundary’s stream, preserving original point timestamps, then
purges the old subjects; ownership follows the tree.
Retention and durability
Streams keep the most recent 20,000 messages per subject by default. Because the limit is per subject, current state — including rarely-written configuration points — is always preserved, which time- or size-based retention could not guarantee. The default is sized so that:
- data reported every 10 minutes keeps about four months of local history, and per-minute data about two weeks,
- configuration subjects, written a handful of times, are effectively unlimited, and
- disk use on unattended edge devices stays bounded (a 1-per-minute subject would otherwise grow by ~525k messages a year).
The default is deliberately generous, because compression absorbs most of what the extra history costs — four times the messages take well under twice the disk of the earlier uncompressed default — and because history that has already wrapped cannot be recovered. Keeping too much is the cheaper mistake. A device with little flash can lower it.
History is tiered by write rate: fast subjects wrap sooner locally, and long-term history for them belongs in an external time-series database fed by the Db client, which reads the streams gap-free.
--storeMaxMsgsPerSubject (or SIOT_STORE_MAX_MSGS_PER_SUBJECT) overrides the
default; -1 means unlimited. Each instance applies its own policy to every
stream on its own disk — including replica streams, which the sync pumps create
bare and the store configures when it discovers them — so a hub and a device can
retain different amounts of the same data.
The store logs the policy it resolved when it starts, so the effective value is visible without inspecting a stream:
STORE: retention: 20000 points per subject (default); current state is always preserved
STORE: retention: 50000 points per subject; current state is always preserved
STORE: retention: unlimited points per subject
The setting is otherwise invisible once an instance is running, particularly
when it comes from the environment rather than the command line. To read it back
from a running system instead, nats stream info reports the limit each stream
was given.
Compression
Streams are compressed with S2 by default. Point data compresses unusually well, because the same point type repeats in every message, keys come from a small set, and timestamps march forward — the kind of repetition a compressor is built for. The cost is a small amount of CPU on write and read, far below what any SIOT write rate produces.
JetStream compresses a block when it seals it, not while it is the active block being written, so the saving appears once a store outgrows its first block. Measured on scraped Prometheus points:
| Messages | Uncompressed | S2 | Saving |
|---|---|---|---|
| 20,000 | 6.7 MB | 6.7 MB | none |
| 100,000 | 33.4 MB | 11.7 MB | 65% |
The sealed blocks themselves compress to roughly a sixth of their size; the uncompressed active block is what holds the whole-store figure short of that. A small store therefore gives up nothing and gains nothing, and compression starts paying exactly where disk begins to matter.
--storeCompression (or SIOT_STORE_COMPRESSION) accepts s2 or none.
Turning it on for an instance that already has data is safe: existing messages
stay readable and are recompressed as their blocks are rewritten. As with
retention, each instance applies its own setting to every stream on its own
disk, replica streams included, and the effective value appears in the startup
log:
STORE: compression: s2 (default)
Durability
The JetStream file store fsyncs on a 2-minute interval by default.
--storeSyncInterval (or SIOT_STORE_SYNC_INTERVAL) accepts a Go duration to
shorten that window, or always to fsync every write, for edge devices with
unreliable power, at a write-throughput cost.
Message and payload limits
Retention bounds how much history a subject keeps. A separate limit bounds how many points a single node can hold, and it is worth knowing because exceeding it fails in a way that looks unrelated to the node that caused it.
When a node is requested, the store encodes the node, its points, and — for a
subtree request — its children into one NATS message and publishes it as the
reply (getNodes in store/store.go). SIOT runs the NATS default max_payload
of 1 MB and does not raise it, so that reply has to fit in 1 MB.
Point sizes measured with cmd/point-size and against real data:
| Point | Encoded size |
|---|---|
| Typical reading (short type, no key) | ~34 bytes |
| Long type with a multi-label key, as a Prometheus scrape produces | ~100 bytes |
A node holding 10,000 scraped points therefore encodes to about 1 MB on its own.
data.DecodePoints independently refuses an array of more than 10,000 points.
What exceeding it looks like
The publish is rejected, nothing is sent, and the requester waits out its timeout:
NATS: Error publishing response to node request: nats: maximum payload exceeded
Error getting nodes for user: error getting children: nats: timeout
Because a reply carries a subtree rather than a single node, every tree fetch covering the node fails, so the UI stops loading for that user entirely rather than showing one broken node. The messages name neither the node nor the point count, which is what makes this worth documenting.
Lowering whatever setting produced the points does not fix it. Points are current state and persist until removed, so recovery means deleting the node — or, if the UI cannot load, stopping SIOT, purging that node’s subjects, and restarting so the caches repopulate from the tips:
nats stream ls
nats stream purge <stream> --subject "inst.*.*.<nodeID>.p.>"
Keeping nodes within it
A node with points in the hundreds is comfortable; one in the thousands deserves thought. Clients that can generate points in bulk bound themselves:
- The metrics client caps a Prometheus scrape at 3000 series, about 350 KB, and reports a larger configured limit on the node rather than honoring it.
- The same client’s
allProcessestype is disabled in the UI, since a modern system has thousands of processes.
A source too large for one node is better split across several. Nodes are inexpensive, and a limit or a failure then affects only the part of the source it belongs to.
Instance metadata
A small META key/value bucket (also JetStream) holds the instance’s root node
ID and JWT signing key.
Data Synchronization
Simple IoT synchronizes data between instances by replicating the store’s streams rather than by comparing and copying tree state. Each instance appends only to its own streams (see Store); other instances hold replicas of those streams and merge them at read time. This page explains how the pieces of NATS — core subjects, JetStream streams, durable consumers, and message headers — combine to do this.
ADR-7 records the design analysis. The previous implementation, which compared Merkle-style node hashes and pushed subtrees, is fully replaced; streams carry their own sequence numbers, so nothing needs to be compared to know what is missing.
The model in one paragraph
Every stream has exactly one writing instance (its origin). A device with root
X writes everything to its stream inst_X_X; a hub with root R writes
configuration for the device’s subtree to its own stream inst_X_R. Sync means
each side keeps a copy of the other’s stream: the hub holds a replica of
inst_X_X, the device holds a replica of inst_X_R. Current state on either
side is the merge of the subject tips of both streams — newest timestamp wins,
with a deterministic origin tie-break. Because no instance ever writes remote
data into its own streams, points cannot echo back and forth between
instances: there is no loop to suppress.
   device X                                hub R
  ┌───────────────────┐                  ┌───────────────────┐
  │ inst_X_X (owned)  │ ──── push ─────► │ inst_X_X (replica)│
  │ inst_X_R (replica)│ ◄─── pull ────── │ inst_X_R (owned)  │
  │                   │                  │ inst_R_R (owned)  │
  └───────────────────┘                  └───────────────────┘
     merge tips of both                     merge tips of both
     = current state                        = current state
How each NATS feature is used
Core NATS subjects (p.>, ep.>, up.>) carry points between components
within an instance in real time, exactly as before — clients, rules, and the
UI are unaware of synchronization. The store subscribes to these wire subjects,
persists local writes to its origin streams, and fans points out to up.>
subjects for listeners like rules and database clients.
JetStream streams are both the store and the unit of sync. Because storage
subjects embed the boundary and origin (inst.<boundary>.<origin>.…), a replica
stream on another instance can use the same name and subjects — a copied message
needs no translation.
Durable consumers drive replication. The sync client (which runs on the downstream instance and connects to the upstream’s NATS server, using the URI and auth token on its Sync node) runs two pumps:
- push: a durable consumer on the local
inst_X_Xdelivers each message, and the pump publishes it — same subject, same payload — to the upstream, where the replica stream captures it. - pull: a durable consumer on the upstream’s
inst_X_Rdoes the same in the other direction.
A pump moves messages in windows of up to 256, so the round trips overlap rather than running one at a time — which is what makes a first sync of a long stream practical. A window is acknowledged only after the receiving side confirms every message in it, and a window that fails is resent as a unit with none of it acknowledged. That is what keeps each subject in source order: acknowledging the part that landed would let the resend of a failed message arrive after messages stored later, and the receiving store reads the last message on a subject as that subject’s current value.
A durable consumer remembers its position across disconnects, so a reconnect delivers exactly the messages the other side missed — no rescan, no comparison. This is what replaces the hash tree: the stream sequence is the synchronization state.
The durable is named for the receiving instance, so an instance that loses its identity — a store reset gives it a new root ID — is a new reader as far as the sender is concerned, and receives the sender’s retained history from the beginning.
The pumps move messages and nothing else: they create a missing replica stream but never change an existing stream’s configuration. Each instance’s store owns the configuration of the streams on its own disk and applies its retention policy to replica streams when it discovers them, so a hub can keep more (or less) history of a device’s data than the device keeps itself.
Message headers solve origin attribution. When a store consumes a replica
stream, it merges each message into its caches and, when a tip changes,
re-broadcasts it on the ordinary wire subjects so local clients react — tagged
with a Siot-Origin header naming the writing instance. A store receiving a
wire message tagged with a remote origin merges it and fans it out but never
persists it; the replica stream is the persistent copy. This single rule keeps
the single-writer property intact everywhere.
Life of a connection
- The sync client connects to the upstream NATS server (plain NATS or NATS over WebSocket).
- Adoption: if the upstream tree has no node with this instance’s root ID,
the client announces itself with one edge message; the upstream persists a
device node under its root and creates
inst_X_R, the stream it will write the device’s configuration to. (The announcement is an ordinary untagged write — from the upstream’s view it is its own edge, in its own boundary.) - The push pump ensures the replica stream exists upstream and starts copying; the device’s whole tree — structure, configuration, and history — arrives through it, from sequence 1 on first connect.
- The pull pump copies
inst_X_Rdown, naming the stream directly. The upstream creates it when it adopts the device, so it is there to pull before the hub writes any configuration. Nothing lists or polls the upstream’s streams, so an idle connection carries little beyond keepalives. - Each store’s replica consumers merge the arriving messages and re-broadcast changed tips locally.
Configuration written on the hub before the device ever connects
(pre-provisioning) simply waits in inst_X_R and arrives on first connect.
Offline catch-up
While disconnected, both sides keep writing to their own streams. On reconnect, the durable consumers resume and deliver only the backlog. Two kinds of consumers see that backlog differently:
- State clients (rules, protocol clients, the UI) should not see a replay of stale intermediate values. The store therefore holds re-broadcasts while a replica consumer has a backlog and emits one message per changed subject — the final tip — once it drains.
- History needs every point. It is preserved automatically: the replica stream receives the full backlog in order with original embedded timestamps, so local history stays gap-free (up to each stream’s retention limit). The Db (InfluxDB) client works this way: it consumes the streams with its own durable consumers, so an external time-series database receives every point — including the backlog after a sync outage or the client’s own downtime — rather than only what happened to cross the wire while it was listening. External sinks can follow the same pattern.
Conflicts
Concurrent writes to the same point from two instances are rare in practice — a sensor value has one source, a setting is usually edited in one place. When they happen, every instance applies the same merge rule to the same streams: newest embedded timestamp wins, and equal timestamps resolve to the lexically greater origin ID, so all instances converge on the same value without coordination.
Deleting a device (detach)
The edge that attaches a device into the hub’s tree lives in the hub’s own boundary stream, which the device does not replicate. Tombstoning that edge on the hub therefore detaches the device: the hub stops showing it, while the device keeps operating standalone, unaware. The device does not force itself back into the tree; only the hub can restore the edge (undelete), after which replication resumes where it left off.
Current limitations and direction
- Only the instance’s root boundary replicates today; nested device boundaries (a device that itself syncs devices) are planned.
- Replication runs over the ordinary upstream client connection. JetStream
sourcing across NATS leaf connections — where the NATS servers replicate the
streams themselves — is verified to work (see
store/leafnode_spike_test.go) and is the intended replacement once per-instance JetStream domain configuration is worked out. - Authorization is per device: a device credential is granted exactly its own boundary’s streams, which the stream-per-boundary layout makes a one-rule grant. See per-device credentials and the security reference.
- A device’s writes reach the upstream and not the other devices. A node mirrored into several devices receives the upstream’s writes on all of them, since the upstream appends its own writes to the stream it keeps for each device the node is reachable from. A write made on one device lands in that device’s own stream, which the other devices do not replicate. See a node reaches every device it is mirrored into and issue 810.
See the Stage 3 plan for the full status list.
Bandwidth
Many connected products reach the cloud over cellular links billed by the megabyte. Low-cost IoT plans often carry 10 to 50 MB a month, which is about 1 MB a day, or 12 bytes a second averaged over the month. This page shows where a Simple IoT device’s traffic to its upstream comes from, what each part costs, and which settings bring a device within that budget.
The figures below were measured on a device and an upstream connected over plain NATS, with a proxy logging every protocol message between them. They count NATS protocol bytes. The carrier also bills IP and TCP headers and TCP acknowledgments, which add roughly 20% to 50% for messages this small, and TLS adds a little per message on top. Treat the numbers as a lower bound and leave headroom.
Where the bytes go
A device that syncs with an upstream has a fixed cost to stay connected and a cost for every point it writes.
| Source | Per day | Per month | Setting |
|---|---|---|---|
| Configuration stream keepalive | 0.60 MB | 18 MB | fixed (see below) |
| Connection pings | 0.01 MB | 0.2 MB | fixed |
| Sync byte counters (hourly, the default) | 0.02 MB | 0.7 MB | bytesReportPeriod on the sync node |
| Sync byte counters (every minute) | 1.3 MB | 39 MB | |
| Store metrics (off by default) | 2.8 MB | 84 MB | Store metrics on the device node |
| One point a minute | 0.65 MB | 19 MB | the client writing the point |
| One point every 15 minutes | 0.04 MB | 1.3 MB | |
| One reconnect | about 8 KB | link quality |
An idle device with the defaults uses about 0.6 MB a day, or 19 MB a month, nearly all of it the keepalive. A 30 MB plan then leaves about 11 MB a month for data, which is roughly one point every two minutes across the whole device.
What a point costs
Every point written anywhere in a device’s tree is stored in the device’s stream and replicated upstream. Each one costs about 450 bytes on the link:
- About 260 bytes to publish. The subject carries the device ID twice and
the node ID,
inst.<device>.<device>.<node>.p.<type>.<key>, about 150 characters, followed by a reply inbox named for the device key and the encoded point. - About 190 bytes for the upstream’s acknowledgment, which names the stream and the sequence number.
The value itself is a few bytes, so the cost tracks the number of points a
device writes. Writing fewer points is the most effective way to save data: most
clients have a period point on their node (pollPeriod, period, and the like)
that sets how often they sample.
The keepalive
The device reads the configuration its upstream writes for it through a
JetStream pull consumer on the upstream’s inst_X_R stream (see
Synchronization). A pull request stays open on the upstream for 5
minutes and is then renewed, and the upstream sends an idle heartbeat every 30
seconds so the device can tell that the request is still alive. Together these
cost about 2 KB every 5 minutes.
The pump reads with the NATS client’s Messages, which caps the heartbeat at 30
seconds. Fetch has no such cap: its heartbeat only has to be shorter than half
the request’s expiry. A pump that fetched with a 30-minute expiry and a
15-minute heartbeat would send three messages every 30 minutes instead of twelve
every 5, bringing the keepalive from 18 MB to about 1 MB a month and sending
about one twentieth of the packets. A lost pull request would then take up to 30
minutes to notice; a dropped connection is still caught within minutes by the
connection pings. A push consumer would need no heartbeat at all; that is
possible future work.
Connection pings are separate and small, a few bytes every couple of minutes. They also keep the carrier’s NAT mapping for the connection alive, which prevents the extra cost of a reconnect.
Connecting and reconnecting
Each time the link drops and comes back, the device and the upstream exchange server information, credentials, and stream and consumer state before data flows again: about 8 KB on a small tree. A device on a link that drops ten times a day spends about 2.4 MB a month on reconnects alone, so a stable link matters.
The first connection also sends the device’s entire stream, its whole tree and history, from the beginning. A bare device sends about 14 KB. A device that collected data before it was first connected sends all of it, so connect a device once on a cheaper network, such as Wi-Fi or Ethernet during provisioning, when it has history to deliver.
Measuring a device
The sync node reports txBytes and rxBytes, the totals sent to and received
from the upstream, counted at the network socket so TLS overhead is included.
Each report is itself a pair of points, so a short bytesReportPeriod costs
data of its own; leave it at the hourly default on a metered link and shorten it
only while investigating. See Synchronization.
To find what a device is writing, run siot log against it and watch which
points change and how often, or list the per-subject message counts in its
stream with nats stream subjects. A subject with many more messages than the
rest is usually the place to start.
Budget checklist
For a device on a plan of tens of megabytes a month:
- Leave Store metrics off, and
bytesReportPeriodat its hourly default. - Count the points the device writes. A point written once a minute costs about 19 MB a month, so on a 30 MB plan the whole device can afford about one point every two minutes.
- Do the first sync of a device with history on an unmetered network.
- Watch
txBytes,rxBytes, and the sync count for a few days after deployment. A rising sync count means reconnects, which cost data even when nothing changes.
Ideas
None of these are implemented. They are directions for bringing the cost of a point, and of an idle connection, down further. The estimates are rough and each idea needs measuring before it is adopted.
Send on change
The fewest bytes come from points that are never written. The GPIO, IIO, Modbus,
and 1-Wire clients already publish a value only when it changes (IIO with a
minChange deadband), and republish it every 10 minutes even when it does not,
so a graph and an upstream always have a recent sample. That refresh is most of
what an unchanging input costs.
The filtering belongs in the client that reads the input, which knows the signal’s units and noise, so local rules, local history, and the upstream all see the same points and sync stays a faithful copy of the device’s stream. A shared helper for the IO clients could offer:
- a deadband for every analog input, as an absolute change or a percent of range, compared against the last published value so slow drift is still reported;
- a refresh of 15 minutes for unchanged values;
- a minimum interval, so a noisy input cannot flood the link;
- a debounce for discrete inputs, so a chattering contact sends one change.
The cost of one unchanging input, per month:
| Refresh | Points a day | Today | With 88% compression |
|---|---|---|---|
| 10 minutes | 144 | 1.9 MB | 0.23 MB |
| 15 minutes | 96 | 1.3 MB | 0.16 MB |
Ten unchanging inputs on a 15-minute refresh cost about 13 MB a month today, and about 1.6 MB with the compression described below. Compression would bring the keepalive from 18 MB to about 2 MB a month as well, which leaves most of a 30 MB plan for changes. At that size the IP and TCP headers on each packet, which compression does not reach, become the larger cost, so sending points in bursts matters more.
Shorter IDs
Node and instance IDs are UUIDs written as 36 characters. The same 128 bits encoded as base64url take 22 characters, and base64url uses only characters that are valid in NATS subject tokens and stream names. A point’s subject carries three IDs and the acknowledgment names a stream built from two, so shorter IDs would save about 70 bytes per point. IDs are stored and shown to users, so this changes every existing tree.
Leave the boundary and origin out of the wire subject
Every publish repeats inst.<device>.<device>. because the upstream’s replica
stream captures that subject. The upstream already knows which device a
credentialed connection belongs to, so the device could publish a short subject
such as d.<node>.p.<type>.<key> and the upstream could rewrite it into the
stored form. NATS offers two places to do that: a subject transform on the
replica stream (SubjectTransform in the stream configuration), or a subject
mapping on the device’s account. The device’s local stream keeps the full
subjects, so the pump would rewrite them as it sends.
Short aliases for boundary and origin pairs
Where the full subject has to cross the link, the upstream could assign each
(boundary, origin) pair a short alias when the device enrolls, stored on its
credential node: inst.<device>.<device> becomes, say, a.17. The replica
stream would capture a.17.> and transform it to the stored form. The same idea
could extend to node IDs, with a per-device table of short node numbers, at the
cost of keeping that table consistent on both sides.
Shorter reply inboxes
Each request and each acknowledgment carries a reply inbox that starts with the device’s 56-character public key. Any prefix the upstream can derive from the key works for scoping replies, for example a 22-character hash, which would save about 35 bytes in each direction per point.
Batching
The pump publishes each point as its own message and waits for its own
acknowledgment, which is about 40% of a point’s cost. NATS 2.12 and later can
acknowledge a batch as a whole: atomic batch publish (AllowAtomicPublish)
stores a batch all at once and acknowledges only its last message, and fast
batch publish (AllowBatchPublish) acknowledges periodically. Either fits the
pump’s existing windows, and would remove most acknowledgments.
Holding points on the device and sending them in bursts, every few minutes for example, would also put more data in each packet, so the IP and TCP headers the carrier bills are shared across many points. Fewer, larger transmissions also let a cellular radio stay idle longer, which saves power.
With the 88% compression below, a point’s publish is about 31 bytes and an acknowledgment about 23. Sent on its own, a point also takes about three packets (52 bytes of IP and TCP header each, once TCP acknowledgments are counted) and two TLS records (about 22 bytes each), so the packaging outweighs the point. A burst shares that packaging, and a single acknowledgment, across every point in it. For a device writing one point a minute:
| How points are sent | Per point | Per month |
|---|---|---|
| One at a time, uncompressed | 650 B | 28 MB |
| One at a time, compressed | 254 B | 11 MB |
| Every 5 minutes, compressed | 76 B | 3.3 MB |
| Every 15 minutes, compressed | 46 B | 2.0 MB |
The cost is latency upstream: a change reaches the upstream up to one burst interval late. Rules on the device still act at once, since they read the local store, and a change that should not wait, such as an alarm, could send its burst immediately.
Compression
Point messages repeat the same subjects over and over, which compresses well
when the compressor can remember earlier messages. NATS supports compression on
WebSocket connections (Compression in the client options, with compression
enabled on the server’s WebSocket listener), and sync already accepts ws://
URIs.
A test build with compression turned on in the client, the server’s WebSocket listener, and the HTTP port’s WebSocket proxy measured this, with a point written every 5 seconds:
| Link | Total |
|---|---|
nats:// | 102 B/s |
ws:// without compression | 104 B/s |
ws:// with compression | 84 B/s |
WebSocket framing adds about 2%, and compression saves about 19%. The saving is modest because the NATS client and the WebSocket library both compress each message on its own, so a subject repeated on every point is never reused.
A compressor that keeps its state across messages does far better. Replaying a recorded sync stream (a point every 5 seconds, plus the idle traffic) through compressors that flush after every write, so no message waits:
| Compression | Bytes, both directions | Saving |
|---|---|---|
| None | 30,921 | |
| Deflate, each message on its own | 24,654 | 20% |
| Deflate, state kept across messages | 3,601 | 88% |
| Same, with a 4 KB window | 3,792 | 88% |
| zstd, state kept across messages | 3,736 | 88% |
A point’s publish shrinks from about 260 bytes to about 30, because the subject, reply inbox, and stream name repeat almost exactly from one message to the next. This is the largest single saving on this page, and it needs no change to subjects, IDs, or how sync replicates streams.
Neither the NATS client nor the server offers this on a client connection, so Simple IoT would provide the transport itself: a connection wrapper that compresses each write with deflate or zstd and flushes it, used by the sync client’s dialer for a new URI scheme, and a listener on the upstream that decompresses and hands the connection to the embedded NATS server. TLS sits outside the compression, since compressed ciphertext saves nothing.
Leaf node connections support S2 compression, but the NATS server compresses each flush on its own, starting a new stream every time. A point a minute is a flush a minute, so a leaf node saves about what per-message compression does.
With messages this small, the IP and TCP headers on each packet (about 52 bytes, plus acknowledgment packets) become most of what the carrier bills, so compression pairs well with sending points in bursts.
A push consumer for configuration
A push consumer delivers configuration from the upstream without the device renewing a pull request, so it needs no idle heartbeat and would remove most of the 18 MB a month an idle device spends on the keepalive. The pump’s windows rely on in-order redelivery, which would need to be reworked for push delivery. Fetching with a long heartbeat (see The keepalive) gets most of the same saving with no change to how the pump orders deliveries.
Faster reconnects
TLS session resumption would shorten the handshake on each reconnect, and the device could skip requests whose answers it already holds, such as the upstream root, when it reconnects to the same upstream.
A 10 MB a month budget
A hypothetical device shows how these ideas add up. It has 10 analog and 5 discrete inputs, sends on change with a 15-minute refresh, and syncs over TLS with the compression described above. Each analog input changes significantly 24 times a day and each discrete input 20 times, on top of its refresh. The link drops twice a day.
The first column adds only send on change and compression. The second adds the
rest of the practical options on this page: batching every 5 minutes, a Fetch
keepalive with a 30-minute expiry and a 15-minute heartbeat (see
The keepalive), and connection pings every 5 minutes.
| Use | Send on change and compression | All practical options |
|---|---|---|
| Refresh of unchanged inputs (1,440 a day) | 2.3 MB | 1.3 MB |
| Changes (340 a day) | 0.6 MB | 0.3 MB |
| Sync byte counters (hourly) | 0.1 MB | 0.04 MB |
| Configuration keepalive | 2.2 MB | 0.1 MB |
| Configuration changes from the upstream | under 0.1 MB | under 0.1 MB |
| Connection pings | 0.2 MB (every 2 minutes) | 0.1 MB (every 5 minutes) |
| Reconnects, with a full TLS handshake | 0.4 MB | 0.4 MB |
| TLS record overhead | 5.7 MB | 0.9 MB |
| IP and TCP headers | 22 MB | 3.5 MB |
| Total | about 34 MB | about 7 MB |
The estimates assume:
- a point compresses to 54 bytes, or 31 bytes when a batch shares one acknowledgment;
- each packet carries 52 bytes of IP and TCP header, and each message sent on its own takes about three packets once TCP acknowledgments are counted;
- each TLS 1.3 record adds about 22 bytes, and a full handshake about 5 KB;
- batching sends whatever has changed every 5 minutes, in about three packets per burst;
- the
Fetchkeepalive sends a pull request, receives one heartbeat, and receives one expiry notice every 30 minutes, about 80 bytes compressed.
Shorter IDs, subject aliases, and shorter reply inboxes are left out. With compression keeping its state across messages, the repeated IDs they remove already cost only a few bytes per point.
Compression shrinks what each message carries, but every message still costs a
packet, its headers, a TLS record, and an acknowledgment. Once messages are tens
of bytes, those per-packet costs are most of the bill: the configuration
keepalive’s heartbeat every 30 seconds costs about 9 MB a month in headers
alone. Send on change and compression get the payload under budget; reaching 10
MB also takes fewer packets, which is what batching, a long Fetch heartbeat,
and less frequent pings provide.
The ping interval is the remaining fixed cost. Pings keep the carrier’s NAT mapping alive, and carriers differ in how long an idle TCP connection survives, so measure on the target network before stretching it.
Reliability
Reliability is an important consideration in any IoT system as these systems are often used to monitor and control critical systems and processes. Performance is a key aspect of reliability because if the system is not performing well, then it can’t keep up and do its job.
High Availability
Reliability also covers what happens when part of the system is down. The high availability reference describes what the store and synchronization design already protect, what running against an external or hosted NATS cluster would take, and what happens to points published while the application is stopped.
Point Metrics
The fundamental operation of SimpleIoT is that it process points, which are
changes to nodes. If the system can’t process points at the rate they are
coming in, then we have a problem as data will start to back up and the system
will not be responsive.
Points and other data flow through the NATS messaging system, therefore it is perhaps the first place to look. We track several metrics that are written to the root device node to help track how the system is performing.
These metrics are off by default. Turn them on with Store metrics on the
root device node (the storeMetrics point), and set how often they are reported
with storeMetricsPeriod, in seconds (60 when unset, 10 at the least). They are
ordinary points on the root node, so they replicate upstream like any other
data, and an upstream can turn them on for a device it syncs with.
The NATS client buffers messages that are received for each subscription and
then messages are
dispatched serially one message at a time.
If the application can’t keep up with processing messages, then the number of
buffered messages increases. This number is occasionally read and then
min/max/avg written to the metricNatsPending* points in the root device
node.
The time required to process points is tracked in the metricNatsCycle* points
in the root device node. The cycle time is in milliseconds.
We also track point throughput (messages/sec) for various NATS subjects in the
metricNatsThroughput* points.
These metrics should be graphed and notifications sent when they are out of the normal range. Rules that trigger on the point type can be installed high in the tree above a group of devices so you don’t have to write rules for every device.
Database interactions
Database operations greatly affect system performance. When Points come into the system, we need to store this data in the primary and time series stores (ex InfluxDB). The time it takes to read and write data greatly impacts how much data we can handle.
IO failures
All errors reading/writing IO devices should be tracked at both the device and bus level. These can be observed over time and abnormal rates can trigger notifications. Error counts should be reported at a low rate to avoid using bandwidth and resources - especially if multiple counts are incremented on an error (IO and bus).
Logging
Many errors are currently reported as log messages. Eventually some effort should be made to turn these into error counts and possibly store them in the time series store for later analysis.
High Availability
Availability in Simple IoT is not one problem but two, and they have different answers. Keeping data safe when something is down is largely solved by the store and synchronization design. Keeping the application serving continuously through a failure is not solved today, and this page describes what stands in the way and which approaches fit the architecture.
Three facts from the current implementation shape every option below:
- Each stream has exactly one writing instance. Only the origin instance
appends to
inst_<boundary>_<origin>. This single-writer property is what makes synchronization echo-free and the merge deterministic (see Store and ADR-7). - The store runs inside the SIOT process. It subscribes to the core NATS
wire subjects
p.>andep.*.*and turns what arrives into JetStream appends (store/store.go). NATS on its own stores nothing on those subjects. - Streams are created with a single replica.
CreateOrUpdateStreaminstore/jetstream.gosets noReplicasfield, so streams and theMETAKV bucket default to one. Nothing in the code asks for quorum.
What the design already provides
The strongest availability property in the system is at the edge. A synced device writes to its own local stream and replicates through a durable consumer, so an upstream instance can be down for hours and the device loses nothing: on reconnect the consumer resumes at its recorded position and delivers the backlog, with original timestamps, in order. History stays gap-free up to the stream’s retention limit. See Synchronization for the mechanism.
The same pattern protects consumers of the data. The Db client reads the
boundary-origin streams with its own durable consumers (client/db.go), so an
external time-series database receives every point across the client’s own
downtime, not only what happened to cross the wire while it was listening.
External sinks can follow the same pattern.
What neither of these covers is a point published directly to a wire subject while the application is stopped. That case is described in When SIOT is not running below.
Approaches to application redundancy
Active/passive against a clustered NATS server
This is the approach that fits the architecture. NATS runs as a cluster, JetStream streams are configured with three replicas, and several SIOT processes contend for a lease so that exactly one is active at a time. The single-writer property is preserved because only the active process writes.
JetStream supplies the election primitive directly: a revision-checked Update
on a KV key is a compare-and-set, so a leader lease can be built with no
dependency beyond what the store already uses.
Two pieces of work are prerequisites:
- Replica count must be configurable. A single-replica stream on a cluster
lives on one server, so it is unavailable while that server restarts and it
gains nothing from the cluster. Both
StreamConfig.Replicasand theMETAKV bucket need to follow a setting. - Failover time needs measuring.
loadAllStreamsreads every stream’s subject tips into the caches before the store serves anything, so a standby’s time to become useful scales with the number of subjects rather than the depth of history. This is worth measuring against a realistic tree before promising a recovery time.
Active/active
Running two SIOT processes against one store does not work today, and the
reasons are structural rather than incidental. Both processes read the same root
ID from the shared META bucket, so both become the origin for the same
streams. Both subscribe to p.> and persist every point, which duplicates
appends (harmless to the merge, which is idempotent, but doubling storage), and
both answer nodes.*.* requests, so a requester receives two replies. Every
client also runs twice: rules fire twice, Modbus polls twice, database writes
happen twice.
Making this work would require per-process instance identity and arbitration over which process owns which clients. That is a substantial change to the model, and active/passive delivers most of the benefit without it.
Peer instances replicating through synchronization
Two instances, each with its own root node and its own streams, replicating to each other preserves the single-writer property cleanly. It is the natural extension of what synchronization already does.
Two limitations apply today. Synchronization is shaped for a device-to-hub relationship, and only the instance’s root boundary replicates; nested device boundaries are planned but not implemented. Failover also means clients repointing at the surviving instance, since there is no shared address. This is a resilience arrangement rather than a load-balancing one.
Running against an external NATS server
SIOT can already run against a NATS server it does not start.
--natsDisableServer suppresses the embedded server, and --natsServer (or
SIOT_NATS_SERVER) points the process at another one. That covers self-hosted
clusters and hosted services such as Synadia Cloud as far as the connection
itself is concerned.
Four things need attention before a hosted cluster is a working deployment:
| Area | Current state | What is needed |
|---|---|---|
| Authentication | Token only (nats.Token in server/server.go) | An nats.UserCredentials option, since hosted services authenticate with NKey/JWT credentials |
| Stream replicas | One replica, not configurable | A replica setting applied to streams and the META bucket |
| Frontend WebSocket | The UI connects over WebSocket through the HTTP server, presenting the user’s JWT to the in-process authorizer | A hosted WebSocket endpoint that accepts the user JWT, which realistically means NATS auth callout against the same check |
| Write latency | nodePoints publishes each point synchronously and waits for its acknowledgment (store/jetstream.go) | Measurement against the target cluster; a wide-area round trip with quorum replaces a sub-millisecond local write with tens of milliseconds, serially per point |
The frontend path is the largest piece of real work, and write latency is the one most likely to constrain a hub with many devices. Both are worth proving with a small deployment before committing to a hosted provider.
An external NATS server also moves the data. Backups, restores, and
--resetStore all act on storage that is no longer on the SIOT host, which
changes how an instance is operated and recovered.
A hosted cluster makes NATS highly available. The application is a separate question, because the application is what persists points and runs clients. The next section describes what that distinction costs when the application stops.
When SIOT is not running
If the application is stopped and a point arrives on a wire subject, the point is discarded and the publisher is not told.
The wire subjects p.> and ep.*.* are plain core NATS, which is at-most-once:
with no subscriber, the server drops the message and the publish still succeeds.
The store is the only thing that captures those subjects into a stream, and it
runs inside the process that is not running.
A hosted NATS server makes this quieter rather than better. The server stays up, so publishes continue to succeed and there is no connection error to alert on.
| Source | Outcome while SIOT is stopped |
|---|---|
External publishers to p.> | Discarded, no error returned |
| HTTP API | Unavailable; the API is served by the same process |
| Synced downstream instances | Safe: buffered in their own streams and delivered when the durable consumer resumes |
| In-process clients | Not running either, so the loss is the polling gap |
| Db client | Its own downtime is covered by durable consumers, but only for points already in a stream |
There are two ways to close the gap for direct publishers.
The approach consistent with the design is to make the publisher a SIOT instance, or to use the edge client, so its points land in a local stream first and synchronization delivers the backlog. This is what synchronization exists to do, and it needs no new mechanism.
The alternative is an ingest stream on the NATS server capturing p.> and
ep.>, which the store drains at startup with a durable consumer. That moves
durability from the application to the server, so points survive a restart of
the application. It is arguably a prerequisite for treating a hosted NATS
deployment as safe. The costs are a second write on every point in addition to
the storage-subject write, and design work on ordering and deduplication.
High-rate points on phrup.> would stay outside it, since they are deliberately
not stored.
Where to start
The most valuable work is making sure data is buffered somewhere durable before the application touches it. That is the gap that loses data rather than merely pausing service, and clustering NATS does nothing for it. Synced devices already have this property; direct publishers do not.
If continuous cloud service is the goal after that, active/passive against a three-replica cluster with a KV-based lease is the shape that fits. The frontend WebSocket path and per-point write latency are the two questions to answer before selecting a hosted NATS provider.
API
Contents
The Simple IoT server currently provides both HTTP and NATS.io APIs. We’ve tried to keep the two APIs a similar as possible so it is easy to switch from one to the other. The Http API currently accepts JSON, and the NATS API uses a binary encoding for points and nodes.
NOTE, the Simple IoT API is not final and will continue to be refined in the coming months.
NATS
NATS.io allows more complex and efficient interactions between various system components (device, cloud, and web UI). These three parts of the system make IoT systems inherently distributed. NATS focuses on simplicity and is written in Go which ensures the Go client is a 1st class citizen and allows for interesting possibilities such as embedding in the NATS server in various parts of the system. This allows us to keep our one-binary deployment model.
The siot binary embeds the NATS server, so there is no need to deploy and run
a separate NATS server.
Point data uses a compact binary encoding (see data/point.go), and a node
reply is a frame built from it (see EncodeNodes in data/node.go): a version
byte, an error string, a node count, then each node as id, type, parent, points,
and edge points. Strings carry a two-byte length, integers are little endian,
and a frame holds at most 10,000 nodes. Protocol buffers remain only where a
specification requires them (Sparkplug B) and for file transfer. Each node point
is sent as a single NATS message with type and key encoded in the subject.
Because the type and key become subject tokens, they may not contain a period,
whitespace, or the NATS wildcards * and >. Listeners read the node ID and
parent ID from fixed positions in a subject, so a type or key carrying a period
would add a token and shift everything after it, delivering the point to the
wrong handler. The store checks every point on the way in and rejects any that
cannot be published, logging the offending type and key and setting an error
point on the node so the sender can be found. A client that generates keys from
names it does not control – sysfs device names, mount points, network interface
names – should pass them through data.SubjectSafeToken first.
- Nodes
nodes.<parentId>.<nodeId>.<type>.<key>- Request/response – returns an array of
data.EdgeNodestructs. parent="all", then all instances of the node are returned.parent is set and id="all", then all child nodes of the parent are returned.parent="root" and id="all"to fetch the root node(s).- The following combinations are invalid:
parent="all" && id="all"
- Parameters can be specified as points in payload
tombstonewith value field set to 1 will include deleted pointsnodeTypewith text field set to node type will limit returned nodes to this typedepthwith valuenalso returns descendantsnlevels below the nodes requested (1adds their children,2grandchildren as well). The reply is flat; theparentfield of each node says where it goes.nodeTypeapplies to the requested nodes only.
- Request/response – returns an array of
p.<nodeId>.<type>.<key>- used to listen for or publish node point changes.
ep.<nodeId>.<parentId>.<type>.<key>- used to publish/subscribe node edge points. The
tombstonepoint type is used to track if a node has been deleted or not.
- used to publish/subscribe node edge points. The
phr.<nodeId>(not currently used)- high rate point data
phrup.<upstreamId>.<nodeId>- High rate point data is rebroadcast upstream.
upstreamIdis the parent of the node that is interested in HR data (currently the db node).nodeIdis the node that is providing the HR data. In the case of a custom HR Dest Node (serial client), the serial client may not be a child of the upstream node.
- High rate point data is rebroadcast upstream.
up.<upstreamId>.<nodeId>.<type>.<key>- node points are rebroadcast at every upstream ID so that we can listen for
point changes at any level. The sending node is also included in this. The
store is responsible for posting to
upsubjects. Individual clients should not do this.
- node points are rebroadcast at every upstream ID so that we can listen for
point changes at any level. The sending node is also included in this. The
store is responsible for posting to
up.<upstreamId>.<nodeId>.<parentId>.<type>.<key>- edge points rebroadcast at every upstream node ID.
- User namespace
- Requests from a browser signed in as a user. The NATS server limits such a
connection to
u.<anchor>.<user>.>for each anchor, a node the user sits directly under, so the anchor and user in the subject are already verified when the store sees them. The store then checks that the target is the anchor or below it (following live edges, mirrors included) and stamps every point with the user as its origin. See the security reference. u.<anchor>.<user>.nodes.<parentId>.<nodeId>- Request/response, as
nodes.<parentId>.<nodeId>above.nodeId(orparentIdwhennodeIdisall) must be under the anchor.
- Request/response, as
u.<anchor>.<user>.p.<nodeId>.<type>.<key>- Node points, as
p.<nodeId>.<type>.<key>above.nodeIdmust be under the anchor. The origin of each point is set to the user.
- Node points, as
u.<anchor>.<user>.ep.<nodeId>.<parentId>- Edge points, as
ep.<nodeId>.<parentId>above.parentIdmust be under the anchor.
- Edge points, as
- Live points arrive on
up.<anchor>.>, which the connection may subscribe to for each of its anchors, and replies on_INBOX_<user>.>, the reply inbox prefix the browser sets.
- Requests from a browser signed in as a user. The NATS server limits such a
connection to
- Sync
sync.streams.<nodeId>- Request/response – returns the names of the streams that hold data for
the boundary
nodeId, which is how a synced device learns what to pull. A device credential allows this request for the device’s own ID only. See the store reference for the stream layout.
- Request/response – returns the names of the streams that hold data for
the boundary
- Legacy APIs that are being deprecated
node.<id>.file(not currently implemented)- Is used to transfer files to a node in chunks, which is optimized for unreliable networks like cellular and is handy for transferring software update files.
- Auth
auth.user- Used to authenticate a user. Send a request with email/password points, and the system will respond with the User nodes if valid. There may be multiple user nodes if the user is instantiated in multiple places in the node graph. A JWT node will also be returned with a token point. This JWT should be used to authenticate future requests. The frontend can then fetch the parent node for each user node.
auth.me- Request with the user’s JWT as the payload. The reply is the user’s node
at each place it sits in the tree (without the password hash), so the
parentof each is an anchor the connection may reach. The browser calls this after connecting to learn what to fetch.
- Request with the user’s JWT as the payload. The reply is the user’s node
at each place it sits in the tree (without the password hash), so the
enroll.request- Request with a device ID, public key, and description. An instance with no credential asks the upstream for one here. The connection presents an enrollment token together with the key being enrolled, the request has to name that same key, and this subject plus its own reply inbox is all it may reach. See devices that enroll themselves.
auth.deviceKey- Request/response – returns this instance’s device public key as
{pubKey}. The seed stays in the server process.
- Request/response – returns this instance’s device public key as
auth.deviceSign- Request with a nonce; the reply is the nonce signed with this instance’s device key, or empty when the instance has none. The sync client uses it to authenticate to an upstream with the device key without holding the seed.
- Admin
admin.error(not implemented yet)- Any errors that occur are sent to this subject
admin.storeVerify- Used to initiate a database verification process. This currently verifies hash values are correct and responds with an error string.
admin.storeMaint- Corrects errors in the store (current incorrect hash values)
HTTP
For details on data payloads, it is simplest to just refer to the Go types which have JSON tags. HTTP APIs currently return JSON payloads.
Most APIs that do not return specific data (update/delete) return a standard response
Every node route needs credentials: the shared token as the Authorization
header, or Authorization: Bearer <jwt> with a user’s sign-in token or a
device’s signed token. A user’s request is refused when the node in the path, or
a parent named in the body, is outside the groups the user belongs to, and
replies to a user or device carry secret points with an empty value. See the
security reference.
- Nodes
- data structure
/v1/nodes- POST: insert a new node
/v1/nodes/:id- GET: return info about a specific node. Body can optionally include the id of parent node to include edge point information.
- DELETE: delete a node
/v1/nodes/:id/parents- POST: move node to new parent
- PUT: mirror/duplicate node
- body is JSON
api/nodes.go:NodeMoveorNodeCopystructs
/v1/nodes/:id/points- POST: post points for a node
/v1/nodes/:id/cmd- GET: gets a command for a node and clears it from the queue. Also clears
the
CmdPendingflag in the Device state. - POST: posts a
cmdfor the node and sets the nodeCmdPendingflag.
- GET: gets a command for a node and clears it from the queue. Also clears
the
/v1/nodes/:id/not- POST: publish a notification point on the node, which reaches the users and messaging services in scope as described in the notification documentation
- Device access: a request with
Authorization: Bearer <jwt>where the JWT is signed by an enrolled device key (client.DeviceJWT) may GET a node, POST points, or POST a notification, on the device node or below it. See the security reference. /v1/nodes/:id/key- POST: generate a token for
enrollTokennodeid. The hash is written on the node and{token}is returned once; the token itself is never stored. See devices that enroll themselves.
- POST: generate a token for
- Auth
/v1/auth- POST: accepts
emailandpasswordas form values, and returns a JWT Auth token
- POST: accepts
HTTP Examples
You can post a point using the HTTP API without authorization using curl:
curl -i -H "Content-Type: application/json" -H "Accept: application/json" -X POST -d '[{"type":"value", "value":100}]' http://localhost:4223/v1/nodes/be183c80-6bac-41bc-845b-45fa0b1c7766/points
If you want HTTP authorization, set the SIOT_AUTH_TOKEN environment variable
before starting Simple IoT and then pass the token in the authorization header:
curl -i -H "Authorization: f3084462-3fd3-4587-a82b-f73b859c03f9" -H "Content-Type: application/json" -H "Accept: application/json" -X POST -d '[{"type":"value", "value":100}]' http://localhost:4223/v1/nodes/be183c80-6bac-41bc-845b-45fa0b1c7766/points
Frontend
Elm Reference Implementation
The reference Simple IoT frontend is implemented in Elm as a Single Page
Application (SPA) and is located in the
frontend/
directory.
Code Structure
The frontend is based on elm-spa, and is split into the following directories:
Api: contains core data structures and API code to communicate with the backend.Api.Natsis the port module the node tree is read and written through; the HTTP calls inApi.NodeandApi.Authremain for sign-in and node operations.Pages: the various pages of the applicationComponents: each node type has a separate module that is used to render it.NodeOptions.elmcontains a struct that is used to pass options into the component views.UI: Various UI pieces we usedUtils: Code that does not fit anywhere else (time, etc.)
We’d like to keep the UI optimistic if possible.
The node tree over NATS
Elm 0.19 has no WebSocket support, so public/main.js owns the NATS connection
and Api.Nats carries a small JSON protocol over one port pair. JavaScript owns
the connection; Elm owns the tree.
Commands from Elm: connect {token}, fetch {anchor, parent, id, depth},
watch [subjects], sendPoints {anchor, id, points}, and disconnect. Events
to Elm: connected {userId, anchors}, disconnected, authFailed,
nodes {anchor, parent, id, depth, nodes}, points [{nodeId, points}],
edgePoints [{nodeId, parentId, points}], and error {message}. Points cross
the port in the JSON shape the HTTP API used, so Api.Point.decode and every
component are unchanged.
An anchor is a group the user belongs to; the connection may reach the subtree
under each of its anchors and nothing else. On connected, the page fetches
each anchor with its children and grandchildren. Expanding a node fetches its
children with their children, so each child knows whether it can be expanded,
and collapsing keeps what is there. Utils.NodeTree holds the pure tree code:
merging a fetched subtree into the tree while keeping expansion state and the
deeper levels a reply did not reach, applying live points, and deriving the
watch list. The watch list is every node on screen (up.<anchor>.<id>.*.* for
its points and up.<anchor>.*.<id>.*.* for the edges of its children), sent to
JavaScript whenever it changes; JavaScript brings its subscriptions in line and
batches incoming points per animation frame. An edge for a child the tree does
not have is a new node: the page fetches it. A reconnect, or a tab coming back
into view, refetches everything loaded, since messages in between were missed.
Creating Custom Icons
SIOT icons are 24x24px pixels (based on feather icon format). One way to
create them is to:
- Create a
24x24pxdrawing in Inkscape, scale=1.0 - draw your icon
- if you use text
- Convert text to path: select text, and then menu Path -> Object to Path
- Make sure fill is set for path
- save as plain SVG
- set up a new Icon in
frontend/src/UI/Icon.elmand use an existing custom icon likevariableas a template. - Copy the SVG path strings from the SVG file into the new Icon
- You’ll likely need to adjust the scaling transform numbers to get the icon to the right size
(I’ve tried using: https://levelteams.com/svg-to-elm, but this has not been real useful, so I usually end up just copying the path strings into an elm template and hand edit the rest)
File upload
The File node UI has the capability to upload files in the browser and then store them in a node point. The default max payload of NATS is 1MB, so that is currently the file size limit, but NATS can be configured for a payload size up to 64MB. 8MB is recommended.
Currently the payload is stored in the Point String field for simplicity. If
the binary option is selected, the data is base64 encoded. Long term it may make
sense to support JetStream Object store, local file store, etc.
The elm/file package is used upload a file into the browser. Once the data is in the browser, it is sent to the backup as a standard point payload. Because we are currently using a JSON API, binary data is base64 encoded.
The process by which a file is uploaded is:
- The
NodeOptionsstruct, which is passed to all nodes has anonUploadFilefield, which is used to triggers theUploadFilemessage which runs a browser file select. The result of this select is aUploadSelectedmessage. - This message calls
UploadFile node.node.idinHome_.elm. File.Select.fileis called to select the file, which triggers theUploadContentsmessage.UploadContentsis called with the node id, file name, and file contents, which then sends the data via points to the backend.
SIOT JavaScript library using NATS over WebSockets
frontend/lib
is simpleiot-js, the client the web UI uses to talk to the backend over NATS
WebSockets, and it can be used by any other JavaScript frontend. It connects as
a signed-in user with the JWT from POST /v1/auth, learns which groups the user
belongs to, fetches nodes one subtree at a time, subscribes to live points, and
writes points. The README.md in that directory documents the API; the subjects
are in the API reference.
The library has one dependency, nats.ws, and no build step. The web UI loads
it as native ES modules: siot_build_frontend_js copies siot-nats.js,
codec.js, and nats.ws’s bundle into frontend/public/dist, and an import
map in index.html resolves nats.ws to that copy. siot_build_frontend gzips
them alongside elm.js, and the server decompresses on request.
codec.js mirrors the binary point and node encoding in data/point.go and
data/node.go. The Go test data/point_fixture_test.go writes fixtures into
frontend/lib/testdata, and npm test in frontend/lib decodes and re-encodes
them, so the two encoders are checked against the same bytes. Run the Go test
with UPDATE_FIXTURES=1 after changing the encoding.
Custom UIs
The current SIOT UI is more an engineering type view than something that might be used by end users. For a custom/company product IoT portal where you want a custom web UI optimized for your products, there are several options:
- Modify the existing SIOT frontend.
- Write a new frontend, mobile app, desktop app, etc. The SIOT backend and frontend are decoupled so that this is possible.
Passing a custom UI to SIOT
There are ways to use a custom UI with SIOT at the app and package level:
- Application: pass a directory containing your public web assets to the
app using:
siot serve -customUIDir <your web assets> - Package: populate
CustomUIFSwith afs.FSin the SIOT server options`.
In both cases, the filesystem should contain a index.html in the root
directory. If it does not, you can use the
fs.Sub function to return a subtree of a
fs.FS.
Rules
Rules are defined by nodes and are composed of additional child nodes for conditions and actions. See the node/point schema for more details.
All points should be sent out periodically, even if values are not changing to indicate a node is still alive and eliminate the need to periodically run rules. Even things like system state should be sent out to trigger device/node offline notifications.
Notifications
(see notification user documentation)
Notifications are messages that are sent to users. There are several concerns when processing a notification:
- The message itself and how it is generated.
- Who receives the messages.
- Mechanism for sending the message (Twilio SMS, SMTP, ntfy, etc.)
- State of the notification
- Sequencing through a list of users
- Tracking if it was acknowledged and by who
- Distributed concerns (more than one SIOT instance processing notifications)
- Synchronization of notification state between instances.
- Which instance is processing the notification.
Notifications can be initiated by:
- Rules
- Users sending notifications through the web UI
Notification Data Structures
Notifications and messages travel as points carrying a JSON payload (DataType
is JSON and the payload lives in the point Data field). This means they get
everything points get for free: they are persisted in the store, synchronized
between instances, recorded in history, and visible to clients through the
standard Points() mechanism and up.<parent>.> subscriptions. No side channel
is involved.
Two payload types divide the work (see data/notification.go and
data/message.go):
- Notification (point type
notification) says what happened. It is published on the node that raised it — a rule node when a notify action fires, or any node targeted by the web UI’s message function. It carries a UUID, the source node, a subject, and a message. - Message (point type
message) says what happened and who to send it to. It is published on a user node and carries the notification ID plus the user’s phone and email.
Both point types use a fixed (empty) key, so the point merge collapses each new notification over the previous one: a node’s state carries only its most recent notification, and the full history lives in the JetStream stream. Delivery is not affected by this collapse because clients receive every published point through their subscriptions, independent of the merged state.
Delivery
Delivery happens in up to two hops, and the second hop is optional per service:
- Each user node runs a client subscribed to
up.<parent>.>. When a notification point appears anywhere in the parent’s subtree, the user client emits a message point on its own node, populated with the user’s contact information. Users with no phone or email emit nothing. - Each messaging service node (
msgService) runs a client with the same subscription. Twilio and SMTP need per-user addressing, so they consume message points. The service looks up the node the point was raised on and takes the phone number or email from that user node; a message point raised on a node of any other type is ignored, and the address carried in the point is not used. A service with a global destination — an ntfy topic — consumes notification points directly and works with no user nodes in scope.
Scope comes from position in the tree: a service or user sees notifications raised anywhere in its parent’s subtree, so moving a node changes its notification scope.
Rate limit
Each service sends at most 30 messages at once and then one more every 30 seconds. A message over the limit is dropped and reported on the service node’s error point. The limit is per service node and per instance, and it counts deliveries, so a duplicate suppressed by deduplication does not use it up.
Deduplication
A user mirrored into two groups runs two client instances and emits two message points, and two branches of the tree can converge on the same service node. The service client deduplicates at the point of delivery, keyed by (notification ID, destination address), which enforces the invariant that matters — one message per destination per notification — regardless of topology. The notification ID survives synchronization, so this also covers duplicates arriving from another instance.
Deduplication state is held in memory with entries expiring after one hour. It is not persisted, so a service client restart inside the window can produce a duplicate delivery. This is a bounded and accepted trade for keeping the client free of storage concerns.
Notification State
Acknowledgement and escalation — sequencing through a list of users and tracking who acknowledged — are not implemented. That state does not fit a JSON payload on a single point, because it would require read-modify-write from several instances with no conflict resolution. Implementing it means promoting the notification to a node with ordinary points; that is the trigger for revisiting this design.
Integration
This page discusses ways you can integration Simple IoT into your system. At its core, SIOT is a distributed graph database optimized for storing, viewing, and synchronizing state/config in IoT systems. This makes it very useful for any system where you need distributed state/config.
With SIOT, you run the same application in both the cloud and edge devices, so you can use any of the available integration points at either place.
The SIOT API
This primary way to interact with Simple IoT is through a NATS API. You can add additional processes written in any language that has a NATS client. Additionally, the NATS wire protocol is fairly simple so could be implemented from scratch if needed. If your most of your system is written in C++, but you needed a distributed config/state store, then run SIOT along side your existing processes and add a NATS connection to SIOT. If you want easy scripting in your system, consider writing a Python application that can read/modify the SIOT store over NATS.
SIOT Data Structures
The SIOT data structures are very general (nodes and points) arranged in a graph, so you can easily add your own data to the SIOT store by defining new node and point types as needed. This makes SIOT very flexible and adaptable to about any purpose. You can use points in a node to represent maps and arrays. If your data needs more structure, then nested nodes can accomplish that. It is important with SIOT data to retain CRDT properties. These concepts are discussed more in ADR-1.
The requirement to only use nodes and points may seem restrictive at first, but can be viewed as a serialization format with CRDT properties that are convenient for synchronization. Any distributed database requires meta data around your data to assist with synchronization. With SIOT, we have chosen to make this metadata simple and accessible to the user. It is typical to convert this data to more convenient data structures in your application - much the same way you would deserialize JSON.
The architecture page discusses data structures in more detail.
Time series data and Graphing
If you need history and graphs, you can add InfluxDB and Grafana. This instantly provides history and graphs of all state and configuration changes that happened in the system.
Embedded Linux Systems
Simple IoT was designed with Embedded Linux systems in mind, so it is very efficient - a single, statically linked Go binary with all assets embedded that is ~20MB in size and uses ~20MB of memory. There are no other dependencies required such as a runtime, other libraries, etc. This makes SIOT extremely easy to deploy and update. An Embedded Linux system deployed at the edge can be synchronized with a cloud instance using a sync connection.
Integration with MCU (Microcontroller) systems
MCUs are processors designed for embedded control and are typically 32-bit CPUs
that run bare-metal code or a small OS like FreeRTOS or Zephyr and don’t have as
much memory as MPUs.
MCUs cannot run the full SIOT application or easily implement a full
data-centric data store. However, you can still leverage the SIOT system by
using the node/point data structures to describe configuration and state and
interacting with a Simple IoT like any other NATS client. Points use a compact
binary encoding (see data/point.go) that is straightforward to implement on
MCUs.
If your MCU supports MQTT, then it may make sense to use that to interact with Simple IoT as MQTT is very similar to NATS, and NATS includes a built-in MQTT server. The NATS wire protocol is also fairly simple and can also be implemented on top of any TCP/IP stack.
If your MCU interfaces with a local SIOT system using USB, serial, or CAN, then you can use the SIOT serial adapter.
Serial Devices
Contents
(see also user documentation and SIOT Firmware)
It is common in embedded systems architectures for an MPU (Linux-based running SIOT) to be connected via a serial link (RS232, RS485, CAN, USB serial) to an MCU.
See this article for a discussion on the differences between an MPU and MCU. These devices are not connected via a network interface, so can’t use the SIOT NATS API directly, thus we need to define a proxy between the serial interface and NATS for the MCU to interact with the SIOT system.
State/config data in both the MCU and MPU systems are represented as nodes and points. An example of nodes and points is shown below. These can be arranged in any structure that makes sense and is convenient. Simple devices may only have a single node with a handful of points.
SIOT does not differentiate between state (ex: sensor values) and config (ex: pump turn-on delay) - it is all points. This simplifies the transport and allows changes to be made in multiple places. It also allows for the granular transmission and synchronization of data - we don’t need to send the entire state/config anytime something changes.
SIOT has the ability to log points to InfluxDB, so this mechanism can also be used to log messages, events, state changes, whatever - simply use an existing point type or define a new one, and send it upstream.
Data Synchronization
By default, the serial client synchronizes any extra points written to the serial node. The serial UI displays the extra points as shown below:
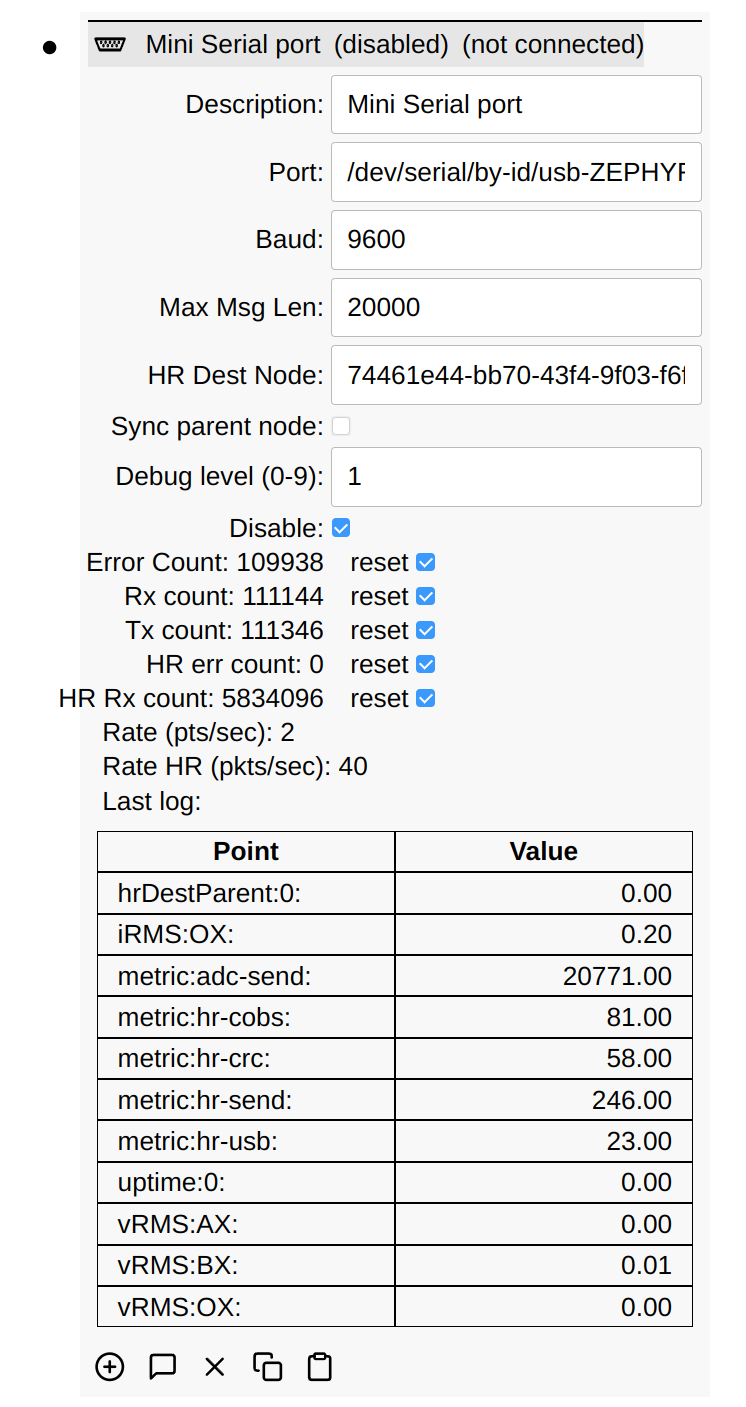
Alternatively, there is an option for the serial client to sync its parent’s points to the serial device. When this is selected, any points received from the serial device are posted to the parent node, and any points posted to the parent node that were not sent by the serial device are forwarded to the serial client.
Protocols
Two wire protocols are available, selected with the protocol point on the
serial node:
binary(or empty) — COBS-framed packets, described below. Compact, and the only protocol supporting high-rate data and file transfer.shell— lines of ASCII exchanged with a Zephyr console shell, described in Shell Protocol.
Binary Protocol
The SIOT serial protocol mirrors the NATS PUB message with a few assumptions:
- we don’t have mirrored nodes inside the MCU device
- the number of nodes and points in a MCU is relatively small
- the payload is always an array of points
- only the following SIOT NATS API subjects are supported:
- blank (assumes ID of Serial MCU client node
p.<id>.<type>.<key>(used to send node points)ep.<id>.<parent>(used to send edge points)phr(specifies high-rate payload)
- We don’t support NATS subscriptions or requests - on startup, we send the entire dataset for the MCU device in both directions (see On connection section), merge the contents, and then assume any changes will get sent and received after that.
subject can be left blank when sending/receiving points for the MCU root node.
This saves some data in the serial messages.
The point type nodeType is used to create new nodes and to send the node type
on connection.
All packets are ack’d (in both directions) by an empty packet with the same sequence number and subject set to ‘ack’. If an ack is not received in X amount of time, the packet is retried up to 3 times, and then the other device is considered “offline”.
Encoding
Packet Frame
All packets between the SIOT and serial MCU systems are framed as follows:
sequence (1 byte, rolls over)
subject (16 bytes)
payload (binary encoded point array or HR repeated point payload)
crc (2 bytes) (Currently using CRC-16/KERMIT) (not included on log messages)
Protocols like RS232 and USB serial do not have any inherent framing; therefore, this needs to be done at the application level. SIOT encodes each packet using COBS (Consistent Overhead Byte Stuffing).
Log payload
The log message is specified with log in the packet frame subject. The payload
is ASCII characters and CRC not included.
Point payload
Points are encoded using a compact binary format (see data/point.go
Encode/DecodePoints). The format is:
count (4 bytes, little-endian uint32)
repeated:
  type (2 byte length prefix + string)
  key (2 byte length prefix + string)
  time (8 bytes, little-endian int64, nanoseconds since epoch)
  dataType (1 byte: 0=unknown, 1=float, 2=int, 3=string, 4=JSON)
  data (2 byte length prefix + bytes)
  tombstone (4 bytes, little-endian int32)
  origin (2 byte length prefix + string)
This encoding is used for low-rate samples, config, state, etc.
High-rate payload
A simple payload encoding for high-rate data can be used to avoid the overhead
of Protobuf encoding and is specified with phr in the packet frame subject.
type (16 bytes) point type
key (16 bytes) point key
starttime (uint64) starting time of samples in ns since Unix Epoch
sampleperiod (uint32) time between samples in ns
data (variable, remainder of packet), packed 32-bit floating point samples
This data bypasses most of the processing in SIOT and is sent to a special
phr NATS subject. Clients that are interested in high-rate data
(like the InfluxDB client) can listen to these subjects.
File payload
This payload type is for transferring files in blocks. These files may be used for firmware updates or other transfers where large amounts of data need to be transferred. An empty block with index set to -1 is sent at the end of the transfer.
name (16 bytes) filename
index (4 bytes) file block index
data (variable, remainder of packet)
On connection
On initial connection between a serial device and SIOT, the following steps are done:
- The MCU sends the SIOT system an empty packet with its root node ID
- The SIOT systems sends the current time to the MCU (point type
currentTime) - The MCU updates any “offline” points with the current time (see offline section).
- The SIOT acks the current time packet.
- All the node and edge points are sent from the SIOT system to the MCU, and
from the MCU to the SIOT system. Each system compares point time stamps and
updates any points that are newer. Relationships between nodes are defined by
edge points (point type
tombstone).
Timestamps
The Simple IoT uses a 64-bit nanosecond since Unit epoch value for all timestamps.
Fault handling
Any communication medium has the potential to be disrupted (unplugged/damaged wires, one side off, etc.). Devices should continue to operate and when re-connected, do the right thing.
If an MCU has a valid time (RTC, sync from SIOT, etc.), it will continue operating, and when reconnected, it will send all its points to re-sync.
If an MCU powers up and has no time, it will set the time to 1970 and start operating. When it receives a valid time from the SIOT system, it will compute the time offset from the SIOT time and its own 1970 based time. It then indexes through all points and adds the offset to any points with time less than 2020, and then send all points to SIOT.
When the MCU syncs time with SIOT, if the MCU time is ahead of the SIOT system, then it set its time, and look for any points with a time after present, and reset these timestamps to the present.
Shell Protocol
Many Zephyr applications already expose a shell on their console UART and model their data as points on it. The shell protocol talks to that shell directly, rather than requiring the firmware to implement the binary framing above.
The zephyr-siot library implements
the MCU side. Enable CONFIG_SIOT_POINT_SHELL and the firmware gains a point
cache, a siot shell command, and point streaming.
Framing
Lines terminated by \n, optionally preceded by \r. No COBS and no CRC: the
link is a console, and the shell already defines the framing.
The reader strips VT100 escape sequences and any leading shell prompt, then classifies what remains:
- a
ptline that parses is a point - a line matching the Zephyr log format
(
[HH:MM:SS.mmm,uuu] <lvl> module: text) becomes alogpoint - anything else is ignored
Unrecognized lines are not errors. A console legitimately carries a boot banner,
prompts, and command output, and tolerating all of it is what lets the protocol
work on a link that was never meant to be machine-only. A line longer than
maxMessageLength is dropped and counted in errorCount.
Point line
Both directions use the same fields and differ only in the verb:
pt <type> <key> <INT|FLT|STR|JSN> <data> [<time>]     MCU to SIOT
p  <type> <key> <INT|FLT|STR|JSN> <data> [<time>]     SIOT to MCU
p is the command the Zephyr firmware already registers, so anything SIOT
writes could have been typed by hand. pt differs so that an echoed command is
never mistaken for a point report.
| Field | Notes |
|---|---|
| type | required |
| key | required; 0 when the point has no key |
| data type | FLT, INT, STR, or JSN |
| data | the value, quoted when it needs to be |
| time | optional; RFC 3339 UTC with nine fractional digits |
The MCU uses 0 for a keyless point where SIOT uses an empty key; the client
translates in both directions.
Quoting
Fields are separated by single spaces. A field is emitted bare unless it
contains a space, a double quote, a backslash, or a control character, in which
case it is wrapped in double quotes with \", \\, \r, \n, and \t
escaped. This matches what the Zephyr shell tokenizer accepts, which is the
constraint that fixes the rules — SIOT must satisfy it when writing p
commands, so the same rules apply to pt.
Zephyr’s CONFIG_SHELL_CMD_BUFF_SIZE defaults to 256 bytes. SIOT refuses to
send a longer command rather than letting the shell truncate it silently.
Timestamps
SIOT stamps every point it writes, and the MCU stores that value and hands it back unchanged when the point is emitted. The MCU needs no clock of its own for this; it is a carrier, not a timekeeper.
That round trip is what makes an echo identifiable. The MCU’s p handler
publishes to the same channel its emitter subscribes to, so every point SIOT
writes comes straight back. SIOT drops an inbound point whose value and
timestamp match one it just wrote. Without this the two sides would trade the
same point forever: a point with no timestamp is stamped on arrival, so each lap
looks newer than the last and the store keeps accepting it.
Points the MCU originates carry no timestamp until the firmware has a real clock, and SIOT stamps those on arrival.
The format is RFC 3339 UTC with a fixed nine-digit fractional second
(2026-07-31T12:00:00.000000000Z). The width is fixed deliberately: trimming
trailing zeros, as Go’s time.RFC3339Nano does, makes the encoding
non-canonical and the strings sort incorrectly. Parsing accepts shorter forms,
so a hand-typed command still works; only the formatter is strict.
On connection
<newline>              clear any partial line in the shell input buffer
shell echo off         stop the shell echoing our writes
shell colors off       stop VT100 color sequences
siot stream on         start point streaming
siot dump              request every cached point
There is no time synchronization step, since the firmware has no clock to set.
connected becomes true when the first line arrives, not when the port opens,
and reverts after timeout seconds of silence.
Not supported
High-rate data (phr), file transfer, and packet acknowledgement have no shell
equivalent, and encoding them would mean base64 over a console. Nodes needing
those should use the binary protocol.
RS485
Status: Idea
RS485 is a half duplex, prompt response transport. SIOT periodically prompts MCU devices for new data at some configurable rate. Data is still COBS encoded so that is simple to tell where packets start/stop without needing to rely on dead space on the line.
Simple IoT also supports Modbus, but the native SIOT protocol is more capable - especially for structured data.
Addressing: TODO
CAN
Status: Idea
CAN messages are limited to 8 bytes. The J1939 Transport Protocol can be used to assemble multiple messages into a larger packet for transferring up to 1785 bytes.
Implementation notes
Both the SIOT and MCU side need to store the common set of nodes and points
between the systems. This is critical as the point merge algorithm only uses an
incoming point if the incoming point is newer than the one currently stored on
the device. For SIOT NATS clients, we use the NodeEdge data structure:
type NodeEdge struct {
        ID         string
        Type       string
        Parent     string
        Points     Points
        EdgePoints Points
	Origin     string
}
Something similar could be done on the MCU.
If new nodes are created on the MCU, the ID must be an UUID, so that it does not conflict with any of the node IDs in the upstream SIOT system(s).
On the SIOT side, we keep a list of Nodes on the MCU and periodically check if any new Nodes have been created. If so, we send the new Nodes to the MCU. Subscriptions are set up for points and edges of all nodes, and any new points are sent to the MCU. Any points received from the MCU simply forwarded to the SIOT NATS bus.
DFU
Status: Idea
For devices that support USB Device Firmware Upgrade (DFU), SIOT provides a mechanism to do these updates. A node that specifies USB ID and file configures the process.
Version
The Simple IoT app stores and uses three different version values:
- App Version
- OS Version
- HW Version
The App version is compiled into the application Go binary by the build (see the
envsetup.sh
file). This version is based on the latest Git tag plus hash if there have been
any changes since the tag.
On Linux, the OS version is extracted from the VERSION field in
/etc/os-release. The field can be changed using
the OS_VERSION_FIELD environment variable.
The versions are displayed in the root node as shown below:
Security
Users and downstream devices will need access to a Simple IoT instance. Simple IoT currently provides access via HTTP and NATS.
Simple IoT is pre-1.0 and its defaults favor getting started quickly: an
instance starts with no auth token and an admin/admin account. The
deployment checklist lists what to change before an
instance is reachable by anyone else, and
known limitations records what the September 2026 audit
found and where each item is tracked.
Deployment checklist
For any instance that other people or devices can reach, cloud or edge:
- Set
SIOT_AUTH_TOKEN. With no token, every listener accepts anonymous connections with full access, and the HTTP API accepts requests with noAuthorizationheader. - Change the
adminpassword, on every instance, before the sign-in page is reachable. Nothing forces a change, and the limiter on sign-in attempts only slows a guess against a known password. - Give accounts only to people you would trust with the host. Any account can add nodes that change the machine the instance runs on; see What an account can do.
- Give each device a credential and set
SIOT_DEVICE_AUTH=requiredon the upstream. Prefer enrollment tokens that leave credentials pending over ones that approve automatically. Until items 9 and 10 of the security follow-ups plan land, a device credential is authority over the whole instance, so approve credentials only for devices you control, and do not use auto-approve tokens on an instance that holds other people’s accounts. - Expose only the HTTP port (4223), behind a reverse proxy that terminates TLS.
Firewall the NATS port (4222) unless devices connect to it directly, in which
case configure
SIOT_NATS_TLS_CERTandSIOT_NATS_TLS_KEY. The NATS WebSocket and monitoring listeners bind to loopback only. - Behind a reverse proxy, every connection reaches Simple IoT from loopback, and
Simple IoT does not read
X-Forwarded-For.SIOT_DEVICE_AUTH=requiredtherefore does not limit the shared token on the HTTP port; keep the token off that path and treat it as a secret. Rate limitPOST /v1/authper address in the proxy, since the built-in limiter keys on the account. - On an edge device, firewall all incoming ports unless the local UI is needed. An edge instance usually runs with no token, and write access to an instance is control of the host; see What an account can do.
- Keep a Modbus TCP server node on a trusted network. Modbus has no authentication, and the listener binds every interface.
- Set
SIOT_NATS_WS_ORIGINSto the origin the UI is served from. - Leave
-debugHttpoff in production; it logs sign-in requests and replies. - Run a release built with a current Go toolchain, and keep it updated with
siot update.
What an account can do
The scope checks keep a signed-in user inside the groups the user belongs to:
reads, point writes, edge writes, the HTTP node routes, and the clients’ own
writes all stop at the group. What they do not do is limit which kinds of node
a user may create there. Every client in client.DefaultClients runs on its
node type wherever that node sits in the tree, on the server’s own full-access
connection, so a user in any group can add:
- an
updatenode with anhttpsURL of their choosing, which downloads an image, replaces the instance’s binary, and withautoRebootrunsreboot. This is code execution on the host as the service user; - an
ntpornetworkManagernode, which rewrite the host’s time and network configuration; - a
browsernode, which rewrites the kiosk browser’s configuration; - a
deviceCredunder adevicenode, or anenrollTokenthat approves automatically, which gives the user a device credential (see What a device credential allows); - a
syncnode pointing at a server the user runs, which replicates the instance’s whole tree there, unredacted, and accepts writes back from it; - a
modbusserver node, which opens a listener on every interface, or anmqtt,metrics,shelly, ordbnode, which dials out from the host (SIOT_OUTBOUND_DENY_PRIVATEkeeps those off private addresses).
The trust boundary is therefore the instance, not the group: an account is authority over the machine the instance runs on. For an operator and their own team that is the intended model. For a deployment that gives accounts to people who should not administer the host, the host-changing node types need to be honored only directly under the root, which is tracked as item 1 of the security follow-ups plan; until then, do not give such people accounts.
Inside a group, every member can write every node, including another member’s
pass and email points. A user with an account can also add user nodes to the
group, and a message service delivers to the users in its scope.
Server
For cloud/server deployments, we recommend installing a web server like Caddy in front of Simple IoT. See the Installation page for more information, and the reverse proxy note in the deployment checklist.
Edge
Simple IoT Edge instances initiate all connections to upstream instances; therefore, no incoming connections are required on edge instances and all incoming ports can be firewalled. The HTTP and NATS listeners bind every interface (the NATS WebSocket and monitoring listeners bind to loopback), and an edge instance often runs with no auth token, so the firewall is what keeps the local network out. The installed service is given a generated token; see installation.
HTTP
The web UI signs in with POST /v1/auth and receives a JWT (JSON web token). It
uses the JWT for the node operations that stay on HTTP (add, delete, move,
mirror, duplicate, notify) and as its NATS credential for everything else; see
Browser below. Every node route resolves the request to a principal
and refuses a node outside what that principal may reach: a user is limited to
the groups the user belongs to, on the node named in the path and on any parent
named in the body, so a node cannot be read, written, moved, mirrored, or
attached from outside those groups. A user’s token is refused as soon as the
user is gone from the tree, and a token that names another issuer or was signed
another way is refused. The token is valid for seven days.
Replies to a user leave the values of secret points out and list only the parents the user can see; see Secrets in node reads.
Devices can also reach the node API over HTTP, with either credential the NATS side accepts:
- The shared token, sent as the
Authorizationheader, grants full access. UnderSIOT_DEVICE_AUTH=requiredit is accepted only from loopback, as on the NATS side. - A token signed with the device key, sent as
Authorization: Bearer <jwt>. The token is a NATS-style JWT whose issuer is the device’s public key and which expires within five minutes; the upstream verifies the signature, looks the key up among its credentials, and limits the request to the device’s own subtree: reading nodes, posting points, and posting notifications, on the device node or anything below it.client.DeviceJWTbuilds one from a seed.
A request with no credentials is refused on every node route, whether or not a token is configured. An instance with no token is still open on NATS, so set one; see the deployment checklist.
Sign-in attempts are limited per account: after five failures in a row the
account is refused for a second, doubling with each further failure up to five
minutes, and every failure is logged with its source. The limit is shared by
POST /v1/auth, the auth.user subject, and the NATS authorizer’s check of a
browser’s token.
The HTTP server closes a connection that sends no request within ten seconds or
no complete request within thirty, limits a request body to 4 MB, and sends
Content-Security-Policy, X-Content-Type-Options, X-Frame-Options, and
Referrer-Policy on every response. The policy allows the UI’s own scripts,
styles, and fonts (served from the binary) and a WebSocket back to the server,
and refuses framing. The HTTP port has no TLS of its own; a reverse proxy in
front of it supplies that. With -debugHttp, the bodies of sign-in requests and
replies are not logged.
NATS
The embedded NATS server authenticates every connection on every listener (NATS, WebSocket, and MQTT) through one authorizer inside Simple IoT, so there is no NATS accounts file to manage. Three kinds of credential are accepted:
- The shared token (
SIOT_AUTH_TOKEN) grants full access. The server’s own client, thesiotcommand line tools, and MQTT clients (which send it as the password) use it. When no token is configured the instance is open, as it always has been. - A device credential is an NKey pair. The device keeps the seed in
SIOT_DATA/device.nkey, which only the server process reads: the sync client asks the server to sign the connection challenge onauth.deviceSign, andauth.deviceKeyanswers with the public key alone. The upstream keeps only the public key, in adeviceCrednode under the device’s node, and grants the connection exactly the subjects that device needs to sync. The credential authorizes the one device node it sits under: one under the upstream’s own root node, or under any node that is not a device, authorizes nothing, and a credential markedpending(one a device enrolled itself with) authorizes nothing until an operator clears it. See Device credentials for the workflow. - A user’s sign-in JWT, presented with the user’s node ID as the NATS user and password, grants the groups that user belongs to and nothing else. This is how the web UI connects; see Browser.
SIOT_DEVICE_AUTH (or --deviceAuth) selects how the two combine:
optional(the default) accepts the shared token from anywhere.requiredaccepts the shared token only from loopback connections, so every remote connection has to present a device credential. This is the setting for a fleet on the public internet once every device has a credential. The HTTP port’s WebSocket proxy applies the same rule itself, since the NATS server sees every proxied connection arrive from127.0.0.1: aCONNECTcarrying a token from a remote address is meant to be refused before it is forwarded. The check reads only the first frame and can be passed by splitting or reformatting theCONNECT, so todayrequireddoes not limit the token on the HTTP port (follow-ups item 11). A connection arriving through a reverse proxy on the same host still looks local, on the HTTP routes and the WebSocket alike, so a reverse proxy has to pass the client’s address through or the token has to stay off that path. Treat the shared token as a secret under either setting.
An enrollment token is a third, narrower credential: a connection presenting
one may publish to enroll.request and subscribe to its reply inbox, and
nothing else. The token is presented together with a key, which signs the
connection nonce, so the upstream gives the connection an inbox of its own. The
request has to name that same key, since its reply can only be delivered to that
key’s inbox; a request naming another key is refused. The device ID has to be
usable as a subject token (no period, wildcard, or whitespace). A device that
already has a live credential gets any further key as pending, whatever the
token says, so a token holder cannot take over a known device; and at most 100
devices may wait for approval at once. It exists so a device with no credential
can ask for one; see
Devices that enroll themselves.
Only a hash of the token is stored, in an enrollToken node.
What a device credential allows
A device with root ID X, connecting to an upstream with root ID R, is
granted these subjects and nothing else. Permissions are derived from the device
ID at connect time; nothing about them is stored or configurable.
| Purpose | Subjects |
|---|---|
| Find the upstream root | nodes.root.all |
| Check whether it is adopted | nodes.all.X |
| Announce itself under the root | ep.X.R |
| Push its origin stream | inst.X.X.>, $JS.API.STREAM.INFO.inst_X_X |
| Pull its configuration | $JS.API.STREAM.INFO.inst_X_R, $JS.API.CONSUMER.CREATE.inst_X_R.>, $JS.API.CONSUMER.INFO.inst_X_R.*, $JS.API.CONSUMER.MSG.NEXT.inst_X_R.*, $JS.ACK.inst_X_R.> |
| Receive replies | subscribe _INBOX_<key>.>, the connection’s own inbox |
A device never needs p.>, up.>, auth.*, admin.*, or another instance’s
streams, and the permission set refuses them. Replies arrive on an inbox named
for the device’s public key rather than the _INBOX.> every client on a server
shares, so one device cannot read another’s replies; the device sets the same
prefix on its connection.
The upstream creates inst_X_X itself before a credential authorizes anything,
since a stream create request carries a whole configuration (extra subjects, a
republish, sources) and not just a name. A stream by that name whose
configuration the upstream did not create is replaced, with what it held. The
upstream also creates inst_X_R, the stream it writes the device’s
configuration to, when it adopts the device, so the device pulls it by name and
never lists the upstream’s streams.
The upstream merges what a device writes to inst.X.X.> only where it stays
inside boundary X; see What the store checks.
An instance with no shared token is open, and accepts a device key it does not know the way it accepts a connection with no credentials at all: with full access. A key it does know is scoped as above.
Revocation
The upstream keeps an index of credentials in memory, rebuilt from its tree and
kept current as the tree changes. Disabling a credential, marking it pending,
deleting it, moving it under another node, or deleting the device it sits under
removes it from the index, and the upstream closes every connection
authenticated with it. The device’s sync client sees the refusal, records
credential refused by upstream on its sync node, keeps running standalone, and
tries again every minute. Enabling the credential again lets it back in with
what it queued.
Disabling or deleting an enrollment token closes connections made with it and refuses new ones; devices already enrolled are unaffected.
lastConnect and connected on each credential are maintained by the upstream.
What the store checks
The permission set keeps a device’s writes in its own stream, inst_X_X. The
store then decides what in that stream reaches the tree:
- a point is merged when its node is
Xor underX; - an edge is merged when its parent is
Xor underX, and its child is new, already underX, or in another device’s subtree. A node of the upstream’s own tree, one reached from its root without passing through a device, cannot be moved underXthis way, and neither can an edge close a loop.
A message that does not qualify is held and logged, and merged if a later edge places it inside the boundary, since a stream delivers messages in the order they were written rather than tree order. The start-up load applies the same rule. Streams the instance wrote itself, and those its own upstream writes for it, are trusted.
When the store finds a replica stream for a boundary that is not a node in its tree, it logs a warning naming the stream. That is what a device deleted from the tree while its stream remains looks like, so the stream is still consumed.
Browser
The web UI connects to NATS over the WebSocket the HTTP port proxies (see configuration), presenting the user’s node ID and sign-in JWT as user and password. The authorizer validates the JWT against the store’s key, confirms it was issued to that user, and grants the connection exactly the subtrees the user belongs to. An anchor is a node the user sits directly under; a user in two groups has two.
| Purpose | Subjects |
|---|---|
| Fetch nodes, write points | publish u.<anchor>.<user>.> for each anchor |
| Ask who it is | publish auth.me |
| Live points | subscribe up.<anchor>.> for each anchor |
| Replies | subscribe _INBOX_<user>.>, the connection’s own inbox |
Nothing else: no p.>, nodes.>, ep.>, $JS.>, auth.user, or admin.>.
The server proves the connection may speak for the anchor and user in a u.*
subject; the store checks the target of the request against the anchor and sets
the origin of every point to the user, whatever the browser sent. For a node
read or a point write the target is the node. For an edge write both ends are
checked: the parent has to be under the anchor, and the child has to be under it
already (or be a node new to the tree, or one the user deleted from there and is
restoring), so a node from elsewhere cannot be attached into a group and reached
through the new edge. The store also refuses any edge whose parent already sits
below its child, from any writer, and bounds every walk of the tree, so a loop
cannot be made and would not hold a request open if it were. Neither side needs
the other’s data structures, and no header can be added or left out to get a
different outcome. Details of the subjects are in the
API reference.
What a browser can and cannot do, compared with polling the HTTP API:
| Concern | Before | Now |
|---|---|---|
| Credential on the WebSocket | Shared token, handed out by auth.getNatsURI | The user’s JWT; auth.getNatsURI is gone |
| Anonymous WebSocket connection | Accepted when no token is configured | Refused when a token is configured; an open instance stays open |
| Read scope | Any node in the instance | The user’s anchors and below |
| Write scope | Any subject, any origin | Points under the user’s anchors, origin forced to the user |
| JetStream, admin, auth subjects | Reachable | Not in the permission set |
| A page on another origin | Could connect with the shared token | Cannot authenticate: the JWT lives in this origin’s local storage. SIOT_NATS_WS_ORIGINS can refuse the handshake as well |
| User removed from a group or deleted | Access until the JWT expires | Disconnected within seconds; reconnecting recomputes or refuses |
| Password changed | Access until the JWT expires | Disconnected; the browser returns to sign-in |
| JWT expiry | Not enforced on a live connection | The server closes the connection when the token expires |
Permissions are computed when the connection is made. The authorizer watches the tree and closes a user’s connections when the user’s edges change, so the browser reconnects and is granted the new set, or is refused if the user is gone. The HTTP node routes apply the same scope; see HTTP. A deployment with no shared token still runs open on every NATS listener, WebSocket included; the UI presents its JWT either way and is scoped either way.
A user signs in on the instance whose tree holds it, and a user under a device
node belongs to that device. Sync replicates a device’s user nodes to its
upstream with the rest of the device’s tree, and those users are not accepted at
the upstream’s sign-in, whoever set the password: an upstream operator editing a
device user’s password is administering the device, and a device left with its
default account would otherwise be a default account on the upstream. The store
decides this from the tree (userIsLocal, store/jetstream.go), not from which
instance wrote the password point, so a restart or a copy of the point in
another stream cannot change the answer.
Secrets in node reads
Some points hold credentials: a user’s pass (a bcrypt hash), the authToken
of a sync, message service, database, or Particle node, a sync node’s
enrollToken, a Twilio sid, and a Wi-Fi psk. A node reply to a browser
(through u.<anchor>.<user>.nodes.>) or to a user or device over HTTP carries
these points with an empty value, so the UI can show that a credential is set
without receiving it; writing the point replaces the stored value as usual. A
reply to a browser asking for a node’s parents lists only the parents inside the
user’s groups. The server’s own clients read on the plain nodes.> subject,
which the shared token alone reaches, and see the values. auth.me leaves
pass out. siot export leaves every secret point out unless -secrets is
given.
The instance’s own NKey seed is kept in SIOT_DATA/device.nkey and never as a
point or a reply; see NATS.
External NATS servers
The authorizer is part of the embedded server. An instance started with
-natsDisableServer against an external NATS server relies on that server’s own
configuration for both tokens and device credentials.
The authorizer covers devices, enrollment, and users in process. If a fleet grows to where connect rate or multi-tenancy calls for it, the NATS security model (accounts, decentralized auth) is the escalation path:
Known limitations
An audit at v0.28.0 (September 2026) reviewed the HTTP API, the NATS
authorizer, the store, the clients, the frontend, dependencies, and packaging.
Everything it found that was a bug or a missing check was closed in the release
that followed. A second audit at 1b37e2ab found items 8 to 12, listed below;
see the
security cleanup plan
for what shipped. The items below are still open. The numbers refer to the
security follow-ups plan,
which has the detail and the proposed change for each.
| Area | Limitation | Plan item |
|---|---|---|
| Users | Any account can add an update, ntp, networkManager, or browser node in its own group, and the server acts on it: an account is control of the host. See What an account can do. | 1 |
| Users | Any account can create a device credential, an auto-approve enrollment token, or a sync node in its own group; a sync node replicates the whole tree to a server the user runs and accepts writes back. | 10 |
| Devices | SIOT_DEVICE_AUTH=required does not limit the shared token through the HTTP port’s WebSocket proxy, since the check reads only the first frame. | 11 |
| Users | Any member of a group can write any node under it, including another member’s password. | 2 |
| Users | The sign-in limiter keys on the account, so a known email can be locked out for up to five minutes at a time by anyone who can reach the sign-in page. | 4 |
| Devices | Behind a reverse proxy every connection arrives from loopback, so SIOT_DEVICE_AUTH=required does not limit the shared token on the HTTP port. | 4 |
| Users | The sign-in token lasts seven days; it is refused once the user is gone, but not on a password change until the NATS connection is closed. | 3 |
| Defaults | The first account is admin/admin and nothing forces a change. It is left to the deployment checklist. | 6 |
| Releases | Releases carry checksums and no signature, so siot update trusts the release host. | 5 |
| Clients | Update payloads are not signed; a point can still start a download and restart, from the release host, over HTTPS. | excluded |
What the audit found sound: the binary point and node decoders bound every
length and count; no client runs a command through a shell, disables TLS
verification, or builds a database query from strings; the metrics scraper
bounds its reads; a credentialed device cannot publish to NATS subjects outside
its own boundary, and the store merges only what stays inside it; point types
and keys cannot carry NATS wildcards; the JWT check rejects other signing
algorithms; the web UI renders node values as text, keeps its token out of URLs
and logs, and loads no third-party script; no secrets are committed to the
repository; and govulncheck reports no called vulnerability in the current
source.
Research
This document contains information that has been researched during the course of creating Simple IoT.
Status: this page is a historical record of the exploration that shaped the design; it is not a description of how Simple IoT works today. The hash-tree synchronization discussed below was implemented and later replaced by replicating JetStream streams, which carry their own sequence numbers and avoid the moving-target comparison problem entirely. See ADR-7 for the analysis and decision, and the store and synchronization references for the current design.
Synchronization
An IoT system is inherently distributed. At a minimum, there are three components:
- Device (Go, C, etc.)
- Cloud (Go)
- Multiple browsers (Elm, JavaScript)
Data can be changed in any of the above locations and must be seamlessly synchronized to other locations. Failing to consider this simple requirement early in building the system can make for brittle and overly complex systems.
The moving target problem
As long as the connection between instances is solid, they will stay synchronized as each instance will receive all points it is interested in. Therefore, verifying synchronization by comparing Node hashes is a backup mechanism - that allows us to see what changed when disconnected. The root hashes for a downstream instance changes every time anything in that system changes. Only one value needs to be compared to ensure your entire config is synchronized, but it is also a disadvantage in that the top level hash is changing more often so you are trying to compare two moving targets. This is not a problem if things are changing slow enough that it does not matter if they are changing. However, this also limits the data rates to which we can scale.
Some systems use a concept called Merkle clocks, where events are stored in a Merle DAG and existing nodes in the DAG are immutable and new events are always added as parents to existing events. An immutable DAG has an advantage in that you can always work back in history, which never changes. The SIOT Node tree is mutable by definition. Actual budget uses a similar concept in that it uses a Merkle Trie to represent events in time and then prunes the tree as time goes on.
We could create a separate structure to sync all events (points), but that would require a separate structure on the server for every downstream device and seems overly complex.
Is it critical that we see all historical data? In an IoT system, there are essentially two sets of date - current state/config, and historical data. The current state is most critical for most things, but historical data may be used for some algorithms and viewed by users. The volume of data makes it impractical to store all data in resource constrained edge systems. However, maybe it’s a mistake to separate these two as synchronizing all data might simplify the system.
One way to handle the moving target problem is to store an array of previous hashes for the device node in both instances - perhaps for as long as the synchronization interval. The downstream could then fetch the upstream hash array and see if any of the entries match an entry in the downstream array. This would help cover the case where there may be some time difference when things get updated, but the history should be similar. If there is a hash in history that matches, then we are probably OK.
Another approach would be to track metrics on how often the top level hash is updating - if it is too often, then perhaps the system needs tuned.
There could also be some type of stop-the-world lock where both systems stop processing new nodes during the sync operation. However, if they are not in sync, this probably won’t help and definitely hurts scalability.
Resgate
resgate.io is an interesting project that solves the problem of creating a real-time API gateway where web clients are synchronized seamlessly. This project uses NATS.io for a backbone, which makes it interesting as NATS is core to this project.
The Resgate system is primarily concerned with synchronizing browser contents.
Couch/pouchdb
Has some interesting ideas.
Merkle Trees
- https://en.wikipedia.org/wiki/Merkle_tree
- https://jack-vanlightly.com/blog/2016/10/24/exploring-the-use-of-hash-trees-for-data-synchronization-part-1
- https://www.codementor.io/blog/merkle-trees-5h9arzd3n8
- Version Control Systems Version control systems like Git and Mercurial use specialized Merkle trees to manage versions of files and even directories. One advantage of using Merkle trees in version control systems is we can simply compare hashes of files and directories between two commits to know if they’ve been modified or not, which is quite fast.
- No-SQL distributed database systems like Apache Cassandra and Amazon DynamoDB use Merkle trees to detect inconsistencies between data replicas. This process of repairing the data by comparing all replicas and updating each one of them to the newest version is also called anti-entropy repair. The process is also described in Cassandra’s documentation.
Scaling Merkel trees
One limitation of Merkel trees is the difficulty of updating the tree concurrently. Some information on this:
Distributed key/value databases
- etcd
- NATS key/value store
Distributed Hash Tables
- https://en.wikipedia.org/wiki/Distributed_hash_table
CRDT (Conflict-free replicated datatype)
- https://en.wikipedia.org/wiki/Conflict-free_replicated_data_type
- Yjs
- https://blog.kevinjahns.de/are-crdts-suitable-for-shared-editing/
- https://tantaman.com/2022-10-18-lamport-sufficient-for-lww.html
Databases
- https://tantaman.com/2022-08-23-why-sqlite-why-now.html
- instead of doing:
select comment.* from post join comment on comment.post_id = post.id where post.id = x and comment.date < cursor.date and comment.id < cursor.id order by date, id desc limit 101 - we do:
post.comments().last(10).after(curosr);
- instead of doing:
Timestamps
- Lamport timestamp
- used by Yjs
Other IoT Systems
AWS IoT
- https://www.thingrex.com/aws_iot_thing_attributes_intro/
- Thing properties include the following, which are analogous to SIOT node
fields.
- Name (Description)
- Type (Type)
- Attributes (Points)
- Groups (Described by tree structure)
- Billing Group (Can also be described by tree structure)
- Thing properties include the following, which are analogous to SIOT node
fields.
- https://www.thingrex.com/aws_iot_thing_type/
- Each type has a specified attributes - kind of a neat idea
Industry 4.0
umati
umati (Universal Machine Technology Interface) is a community of machine builders, component suppliers, software vendors, and users working toward open interfaces for machine data. It builds on OPC UA rather than defining a protocol of its own.
- the data models are published as OPC UA companion specifications – around 25 of them so far, covering machine tools, robotics, measurement systems, and plastics machinery, with roughly 30 more in progress
- the central “OPC UA for Machinery” specification carries the building blocks common to any machine: identification, job management, and energy monitoring
- https://umati.app/ is a live demonstration platform showing data from participating machines
- interesting to Simple IoT as a ready-made vocabulary for naming points on factory equipment, and as further reason to build a native OPC UA client; see the OPC UA notes
Architecture Decision Records
This directory is used to capture Simple IoT architecture and design decisions.
For background on ADRs see Documenting Architecture Decisions by Michael Nygard. Also see an example of them being used in the NATS project. The Go proposal process is also a good reference.
Process
When thinking about architectural changes, we should lead with documentation. This means we should start a branch, draft a ADR, and then open a PR. An associated issue may also be created.
ADRs should used primarily when a number of approaches need to be considered, thought through, and we need a record of how and why the decision was made. If the task is a fairly straightforward implementation, write documentation in the existing User and Reference Guide sections.
When an ADR is accepted and implemented, a summary should typically be added to the Reference Guide documentation.
See template.md for a template to get started.
ADRs
| Index | Description |
|---|---|
| ADR-1 | Consider changing/expanding point data type |
| ADR-2 | Authorization considerations. |
| ADR-3 | Node lifecycle |
| ADR-4 | Notes on storing and transferring time |
| ADR-5 | How do we ensure we have valid time |
| ADR-6 | How to handle time in rule schedules |
| ADR-7 | Use NATS Jetstream for the SIOT store |
| ADR-8 | IoT data models: points vs structured data |
Point Data Type Changes
- Author: Cliff Brake Last updated: 2023-06-13
- Issue at: https://github.com/simpleiot/simpleiot/issues/254
- PR/Discussion:
- https://github.com/simpleiot/simpleiot/pull/279
- https://github.com/simpleiot/simpleiot/pull/565
- https://github.com/simpleiot/simpleiot/pull/566
- Status: Review
Contents
Problem
The current point data type is fairly simple and has proven useful and flexible to date, but we may benefit from additional or changed fields to support more scenarios. It seems in any data store, we need at the node level to be able to easily represent:
- arrays
- maps
IoT systems are distributed systems that evolve over time. If can’t easily handle schema changes and synchronize data between systems, we don’t have anything.
Context/Discussion
Should we consider making the point struct more flexible?
The reason for this is that it is sometimes hard to describe a sensor/configuration value with just a few fields.
Requirements
- IoT systems are often connected by unreliable networks (cellular, etc). All devices/instances in a SIOT should be able to functional autonomously (run rules, etc) and then synchronize again when connected.
- all systems must converge to the same configuration state. We can probably tolerate some lost time series data, but configuration and current state must converge. When someone is remotely looking at a device state, we want to make sure they are seeing the same things a local operator is seeing.
evolvability
From Martin Kleppmann’s book:
In a database, the process that writes to the database encodes the data, and the process that reads from the database decodes it. There may just be a single process accessing the database, in which case the reader is simply a later version of the same process—in that case you can think of storing something in the database as sending a message to your future self.
Backward compatibility is clearly necessary here; otherwise your future self won’t be able to decode what you previously wrote.
In general, it’s common for several different processes to be accessing a database at the same time. Those processes might be several different applications or services, or they may simply be several instances of the same service (running in parallel for scalability or fault tolerance). Either way, in an environment where the application is changing, it is likely that some processes accessing the database will be running newer code and some will be running older code—for example because a new version is currently being deployed in a rolling upgrade, so some instances have been updated while others haven’t yet.
This means that a value in the database may be written by a newer version of the code, and subsequently read by an older version of the code that is still running. Thus, forward compatibility is also often required for databases.
However, there is an additional snag. Say you add a field to a record schema, and the newer code writes a value for that new field to the database. Subsequently, an older version of the code (which doesn’t yet know about the new field) reads the record, updates it, and writes it back. In this situation, the desirable behavior is usually for the old code to keep the new field intact, even though it couldn’t be interpreted.
The encoding formats discussed previously support such preservation of unknown fields, but sometimes you need to take care at an application level, as illustrated in Figure 4-7. For example, if you decode a database value into model objects in the application, and later re-encode those model objects, the unknown field might be lost in that translation process. Solving this is not a hard problem; you just need to be aware of it.
Some discussion of this book: https://community.tmpdir.org/t/book-review-designing-data-intensive-applications/288/6
CRDTs
Some good talks/discussions:
I also agree CRDTs are the future, but not for any reason as specific as the ones in the article. Distributed state is so fundamentally complex that I think we actually need CRDTs (or something like them) to reason about it effectively. And certainly to build reliable systems. The abstraction of a single, global, logical truth is so nice and tidy and appealing, but it becomes so leaky that I think all successful systems for distributed state will abandon it beyond a certain scale. – Peter Bourgon
CRDTs, the hard parts by Martin Kleppmann
Infinite Parallel Universes: State at the Edge
Properties of CRDTs:
- Associative (order in which operations are performed does matter)
- Commutative (changing order of operands does not change result)
- Idempotent (operation can be applied multiple times without changing the result, tolerate over-merging)
The existing SIOT Node/Point data structures were created before I know what a CRDT was, but they happen to already give a node many of the properties of a CRDT – IE, they can be modified independently, and then later merged with a reasonable level of conflict resolution.
For reliable data synchronization in distributed systems, there has to be some metadata around data that facilitates synchronization. This can be done in two ways:
- add meta data in parallel to the data (turn JSON into a CRDT, example automerge or yjs)
- express all data using simple primitives that facilitate synchronization
Either way, you have to accept constraints in your data storage and transmission formats.
To date, we have chosen to follow the 2nd path (simple data primitives).
Operational transforms
There are two fundamental schools of thought regarding data synchronization:
- Operation transforms. In this method, a central server arbitrates all conflicts and hands the result back to other instances. This is an older technique and is used in applications like Google docs.
- CRDTs – this is a newer technique that works with multiple network connections and does not require a central server. Each instance is capable of resolving conflicts themselves and converging to the same point.
While a classical OT arrangement could probably work in a traditional SIOT system (where all devices talk to one cloud server), it would be nice if we are not constrained to this architecture. This would allow us to support peer synchronization in the future.
Other Standards
Some reference/discussion on other standards:
Sparkplug
https://github.com/eclipse/tahu/blob/master/sparkplug_b/sparkplug_b.proto
The sparkplug data type is huge and could be used to describe very complex data. This standard came out of the industry 4.0 movement where a factory revolves around a common MQTT messaging server. The assumption is that everything is always connected to the MQTT server. However, with complex types, there is no provision for intelligent synchronization if one system is disconnected for some amount of time – its all or nothing, thus it does not seem like a good fit for SIOT.
SenML
https://datatracker.ietf.org/doc/html/draft-ietf-core-senml-08#page-9
tstorage
The tstorage Go package has an interesting data storage type:
type Row struct {
	// The unique name of metric.
	// This field must be set.
	Metric string
	// An optional key-value properties to further detailed identification.
	Labels []Label
	// This field must be set.
	DataPoint
}

type DataPoint struct {
	// The actual value. This field must be set.
	Value float64
	// Unix timestamp.
	Timestamp int64
}

type Label struct {
	Name  string
	Value string
In this case there is one value and an array of labels, which are essentially key/value strings.
InfluxDB
InfluxDB’s line protocol contains the following:
type Metric interface {
	Time() time.Time
	Name() string
	TagList() []*Tag
	FieldList() []*Field
}

type Tag struct {
	Key   string
	Value string
}

type Field struct {
	Key   string
	Value interface{}
}
where the Field.Value must contain one of the InfluxDB supported types (bool, uint, int, float, time, duration, string, or bytes).
time-series storage considerations
Is it necessary to have all values in one point, so they can be grouped as one entry in a time series data base like influxdb? Influx has a concept of tags and fields, and you can have as many as you want for each sample. Tags must be strings and are indexed and should be low cardinality. Fields can be any datatype influxdb supports. This is a very simple, efficient, and flexible data structure.
Example: location data
One system we are working with has extensive location information (City/State/Facility/Floor/Room/Isle) with each point. This is all stored in influx so we can easily query information for any location in the past. With SIOT, we could not currently store this information with each value point, but would rather store location information with the node as separate points. One concern is if the device would change location. However, if location is stored in points, then we will have a history of all location changes of the device. To query values for a location, we could run a two pass algorithm:
- query history and find time windows when devices are in a particular location.
- query these time ranges and devices for values
This has the advantage that we don’t need to store location data with every point, but we still have a clear history of what data come from where.
Example: file system metrics
When adding metrics, we end up with data like the following for disks partitions:
Filesystem     Size Used Avail Use% Mounted on
tmpfs          16806068224 0 16806068224   0% /dev
tmpfs          16813735936 1519616 16812216320   0% /run
ext2/ext3      2953064402944 1948218814464 854814945280  70% /
tmpfs          16813735936 175980544 16637755392   1% /dev/shm
tmpfs          16813740032 3108966400 13704773632  18% /tmp
ext2/ext3      368837799936 156350181376 193680359424  45% /old3
msdos          313942016 60329984 253612032  19% /boot
ext2/ext3      3561716731904 2638277668864 742441906176  78% /scratch
tmpfs          3362746368 118784 3362627584   0% /run/user/1000
ext2/ext3      1968874332160 418203766784 1450633895936  22% /run/media/cbrake/59b35dd4-954b-4568-9fa8-9e7df9c450fc
fuseblk        3561716731904 2638277668864 742441906176  78% /media/fileserver
ext2/ext3      984372027392 339508314112 594836836352  36% /run/media/cbrake/backup2
It would be handy if we could store filesystem as a tag, size/used/avail/% as fields, and mount point as text field.
We already have an array of points in a node – can we just make one array work?
The size/used/avail/% could easily be stored as different points. The text field
would store the mount point, which would tie all the stats for one partition
together. Then the question is how to represent the filesystem? With the added
Key field in proposal #2, we can now store the mount point as the key.
| Type | Key | Text | Value |
|---|---|---|---|
| filesystemSize | /home | 1243234 | |
| filesystemUsed | /home | 234222 | |
| filesystemType | /home | ext4 | |
| filesystemSize | /home | 1000000 | |
| filesystemUsed | /date | 10000 | |
| filesystemType | /home | btrfs |
Representing arrays
With the key field, we can represent arrays as a group of points, where key
defines the position in the array. For node points to be automatically decoded
into an array struct fields by the SIOT client manager, the key must be an
integer represented in string form.
One example where we do this is for selecting days of the week in schedule rule conditions. The key field is used to select the weekday. So we can have a series of points to represent Weekdays. In the below, Sunday is the 1st point set to 0, and Monday is the 2nd point, set to 1.
[]data.Point{
  {
    Type: "weekday",
    Key: "0",
    Value: 0,
  },
  {
    Type: "weekday",
    key: "1",
    Value: 0,
  },
}
In this case, the condition node has a series of weekday points with keys 0-6 to represent the days of the week.
The SIOT data.Decode is used by the client manager to initialize array fields in a client struct. The following assumptions are made:
- the value in the
keyfield is converted to an int and used as the index into the field array. - if there are missing array entries, they are filled with zero values.
- the data.MergePoints uses the same algorithm.
- if a point is inserted into the array or moved, all array points affected must
be sent. For example, if you have an array of length 20, and you insert a new
value at the beginning, then all 21 points must to be sent. This can have
implications for rules or any other logic that use the Point
keyfield.
This does not have perfect CRDT properties, but typically these arrays are generally small and are only modified in one place.
If you need more advanced functionality, you can bypass the data Decode/Merge functions and process the points manually and then use any algorithm you want to process them.
Point deletions
To date, we’ve had no need to delete points, but it may be useful in the future.
Consider the following sequence of point changes:
- t1: we have a point
- t2: A deletes the point
- t3: B concurrently change the point value
The below table shows the point values over time with the current point merge algorithm:
| Time | Value | Tombstone |
|---|---|---|
| t1 | 10 | 0 |
| t2 | 10 | 1 |
| t3 | 20 | 0 |
In this case, the point becomes undeleted because the last write wins (LWW). Is this a problem? What is the desired behavior? A likely scenario is that a device will be continually sending value updates and a user will make a configuration change in the portal that deletes a point. Thus it seems delete changes should always have precedence. However, with the last write wins (LWW) merge algorithm, the tombstone value could get lost. It may make sense to:
- make the tombstone value an int
- only increment it
- when merging points, the highest tombstone value wins
- odd value of tombstone value means point is deleted
Thus the tombstone value is merged independently of the timestamp and thus is always preserved, even if there concurrent modifications.
The following table shows the values with the modified point merge algorithm.
| Time | Value | Tombstone |
|---|---|---|
| t1 | 10 | 0 |
| t2 | 10 | 1 |
| t3 | 20 | 1 |
Duration, Min, Max
The current Point data type has Duration, Min, and Max fields. This is used for when a sensor value is averaged over some period of time, and then reported. The Duration, Min, Max fields are useful for describing what time period the point was obtained, and what the min/max values during this period were.
Representing maps
In the file system metrics example below, we would like to store a file system type for a particular mount type. We have 3 pieces of information:
data.Point {
  Type: "fileSystem",
  Text: "/media/data/",
  ????: "ext4",
}
Perhaps we could add a key field:
data.Point {
  Type: "fileSystem",
  Key: "/media/data/",
  Text: "ext4",
}
The Key field could also be useful for storing the mount point for other
size/used, etc points.
making use of common algorithms and visualization tools
A simple point type makes it very nice to write common algorithms that take in points, and can always assume the value is in the value field. If we store multiple values in a point, then the algorithm needs to know which point to use.
If an algorithm needs multiple values, it seems we could feed in multiple point types and discriminated by point type. For example, if an algorithm used to calculate % of a partition used could take in total size and used, store each, and the divide them to output %. The data does not necessarily need to live in the same point. Could this be used to get rid of the min/max fields in the point? Could these simply be separate points?
- Having min/max/duration as separate points in influxdb should not be a problem for graphing – you would simply qualify the point on a different type vs selecting a different field.
- if there is a process that is doing advanced calculations (say taking the numerical integral of flow rate to get total flow), then this process could simply accumulate points and when it has all the points for a timestamp, then do the calculation.
Schema changes and distributed synchronization
A primary consideration of Simple IoT is easy and efficient data synchronization and easy schema changes.
One argument against embedded maps in a point is that adding these maps would likely increase the possibility of schema version conflicts between versions of software because points are overwritten. Adding maps now introduces a schema into the point that is not synchronized at the key level. There will also be a temptation to put more information into point maps instead of creating more points.
With the current point scheme, it is very easy to synchronize data, even if there are schema changes. All points are synchronized, so one version can write one set of points, and another version another, and all points will be sync’d to all instances.
There is also a concern that if two different versions of the software use different combinations of field/value keys, there could be information lost. The simplicity and ease of merging Points into nodes is no longer simple. As an example:
Point {
  Type: "motorPIDConfig",
  Values: {
    {"P": 23},
    {"I": 0.8},
    {"D": 200},
  },
}
If an instance with an older version writes a point that only has the “P” and “I” values, then the “D” value would get lost. We could merge all maps on writes to prevent losing information. However if we have a case where we have 3 systems:
Aold -> Bnew -> Cnew
If Aold writes an update to the above point, but only has P,I values, then this point is automatically forwarded to Bnew, and then Bnew forwards it to Cnew. However, Bnew may have had a copy with P,I,D values, but the D is lost when the point is forwarded from Aold -> Cnew. We could argue that Bnew has previously synchronized this point to Cnew, but what if Cnew was offline and Aold sent the point immediately after Cnew came online before Bnew synchronized its point.
The bottom line is there are edge cases where we don’t know if the point map data is fully synchronized as the map data is not hashed. If we implement arrays and maps as collections of points, then we can be more sure everything is synchronized correctly because each point is a struct with fixed fields.
Is there any scenario where we need multiple tags/labels on a point?
If we don’t add maps to points, the assumption is any metadata can be added as additional points to the containing node. Will this cover all cases?
Is there any scenario where we need multiple values in a point vs multiple points?
If we have points that need to be grouped together, they could all be sent with the same timestamp. Whatever process is using the points could extract them from a timeseries store and then re-associate them based on common timestamps.
Could duration/min/max be sent as separate points with the same timestamp instead of extra fields in the point?
The NATS APIs allow you to send multiple points with a message, so if there is ever a need to describe data with multiple values (say min/max/etc), these can simply be sent as multiple points in one message.
Is there any advantage to flat data structures?
Flat data structures where the fields consist only of simple types (no nested objects, arrays, maps, etc). This is essentially what tables in a relational database are. One advantage to keeping the point type flat is it would map better into a relational database. If we add arrays to the Point type, then it will not longer map into a single relational database table.
Design
Original Point Type
type Point struct {
	// ID of the sensor that provided the point
	ID string `json:"id,omitempty"`

	// Type of point (voltage, current, key, etc)
	Type string `json:"type,omitempty"`

	// Index is used to specify a position in an array such as
	// which pump, temp sensor, etc.
	Index int `json:"index,omitempty"`

	// Time the point was taken
	Time time.Time `json:"time,omitempty"`

	// Duration over which the point was taken. This is useful
	// for averaged values to know what time period the value applies
	// to.
	Duration time.Duration `json:"duration,omitempty"`

	// Average OR
	// Instantaneous analog or digital value of the point.
	// 0 and 1 are used to represent digital values
	Value float64 `json:"value,omitempty"`

	// Optional text value of the point for data that is best represented
	// as a string rather than a number.
	Text string `json:"text,omitempty"`

	// statistical values that may be calculated over the duration of the point
	Min float64 `json:"min,omitempty"`
	Max float64 `json:"max,omitempty"`
}
Proposal #1
This proposal would move all the data into maps.
type Point struct {
    ID string
    Time time.Time
    Type string
    Tags map[string]string
    Values map[string]float64
    TextValues map[string]string
}
The existing min/max would just become fields. This would map better into influxdb. There would be some redundancy between Type and Field keys.
Proposal #2
type Point struct {
	// The 1st three fields uniquely identify a point when receiving updates
	Type string
	Key string

	// The following fields are the values for a point
	Time time.Time
	(removed) Index float64
	Value float64
	Text string
	Data []byte

	// Metadata
	Tombstone int
}
Updated 2023-06-13: removed the Index field. We will use the Key field for
array indices.
Notable changes from the first implementation:
- removal of the
IDfield, as any ID information should be contained in the parent node. TheIDfield is a legacy from 1-wire setups where we represented each 1-wire sensor as a point. However, it seems now each 1-wire sensor should have its own node. - addition of the
Keyfield. This allows us to represent maps in a node, as well as add extra identifying information for a point. - the
Pointis now identified in the merge algorithm using theTypeandKey. Before, theID,Type, andIndexwere used. - the
Datafield is added to give us the flexibility to store/transmit data that does not fit in a Value or Text field. This should be used sparingly, but gives us some flexibility in the future for special cases. This came out of some comments in an Industry 4.0 community – basically types/schemas are good in a communication standard, as long as you also have the capability to send a blob of data to handle all the special cases. This seems like good advice. - the
Tombstonefields is added as anintand is always incremented. Odd values ofTombstonemean the point was deleted. When merging points, the highest tombstone value always wins.
Decision
Going with proposal #2 – we can always revisit this later if needed. This has minimal impact on the existing code base.
Objections/concerns
(Some of these are general to the node/point concept in general)
- Q: with the point datatype, we lose types
- A: in a single application, this concern would perhaps be a high priority, but in a distributed system, data synchronization and schema migrations must be given priority. Typically these collections of points are translated to a type by the application code using the data, so any concerns can be handled there. At least we won’t get JS undefined crashes as Go will fill in zero values.
- Q: this will be inefficient converting points to types
- A: this does take processing time, but this time is short compared to the network transfer times from distributed instances. Additionally, applications can cache nodes they care about so they don’t have to translate the entire point array every time they use a node. Even a huge IoT system has a finite # of devices that can easily fit into memory of modern servers/machines.
- Q: this seems crude not to have full featured protobuf types with all the
fields explicitly defined in protobuf. Additionally, can’t protobuf handle
type changes elegantly?
- A: protobuf can handle field additions and removal but we still have the edge cases where a point is sent from an old version of software that does not contain information written by a newer versions. Also, I’m not sure it is a good idea to have application specific type fields defined in protobuf, otherwise, you have a lot of work all along the communication chain to rebuild everything every time anything changes. With a generic types that rarely have to change, your core infrastructure can remain stable and any features only need to touch the edges of the system.
- Q: with nodes and points, we can only represent a type with a single level of
fields
- A: this is not quite true, because with the key/index fields, we can now have array and map fields in a node. However, the point is taken that a node with its points cannot represent a deeply nested data structure. However, nodes can be nested to represent any data structure you like. This limitation is by design because otherwise synchronization would be very difficult. By limiting the complexity of the core data structures, we are making synchronization and storage very simple. The tradeoff is a little more work to marshall/unmarshall node/point data structures into useful types in your application. However, marshalling code is easy compared to distributed systems, so we need to optimize the system for the hard parts. A little extra typing will not hurt anyone, and tooling could be developed if needed to assist in this.
Generic core data structures also opens up the possibility to dynamically extend the system at run time without type changes. For instance, the GUI could render new nodes it has never seen before by sending it configuration nodes with declarative instructions on how to display the node. If core types need to change to do this type of thing, we have no chance at this type of intelligent functionality.
Consequences
Removing the Min/Max/Duration fields should not have any consequences now as I don’t think we are using these fields yet.
Quite a bit of code needs to change to remove ID and add Key to code using points.
Additional Notes/Reference
We also took a look at how to resolve loops in the node tree:
https://github.com/simpleiot/simpleiot/issues/294
This is part of the verification to confirm our basic types are robust and have adequate CRDT properties.
Authorization
- Author: Blake Miner
- Issue: https://github.com/simpleiot/simpleiot/issues/268
- PR / Discussion: https://github.com/simpleiot/simpleiot/pull/283
- Status: Brainstorming
Problem
SIOT currently does not prevent unauthorized NATS clients from connecting and publishing / subscribing. Presently, any NATS client with access to the NATS server connection can read and write any data over the NATS connection.
Discussion
This document describes a few mechanisms for how to implement authentication and authorization mechanisms within Simple IoT.
Current Authentication Mechanism
Currently, SIOT supports upstream connections through the use of upstream nodes. The connection to the upstream server can be authenticated using a simple NATS auth token; however, all NATS clients with knowledge of the auth token can read / write any data over the NATS connection. This will not work well for a multi-tenant application or applications where user access must be closely controlled.
Similarly, web browsers can access the NATS API using the WebSocket library, but since they act as another NATS client, no additional security is provided; browsers can read / write all data over the NATS connection.
Proposal
NATS supports decentralized user authentication and authorization using NKeys and JSON Web Tokens (JWTs). While robust, this authentication and authorization mechanism is rather complex and confusing; a detailed explanation follows nonetheless. The end goal is to dynamically add NATS accounts to the NATS server because publish / subscribe permissions of NATS subjects can be tied to an account.
Background
Each user node within SIOT will be linked to a dynamically created NATS account (on all upstream nodes); each account is generated when the user logs in. Only a single secret is stored in the root node of the SIOT tree.
NATS has a public-key signature system based on Ed25519. These keypairs are called NKeys. Put simply, NKeys allow one to cryptographically sign and verify JWTs. An NKey not only consists of a Ed25519 private key / seed, but it also contains information on the “role” of the key. In NATS, there are three primary roles: operators, accounts, and users. In SIOT, there is one operator for a given NATS server, and there is one account for each user node.
Start-up
When the SIOT server starts, an NKey for the operator role is loaded from a
secret stored as a point in the root node of the tree. This point is always
stripped away when clients request the root node, so it’s never transmitted over
a NATS connection. Once the NATS server is running, SIOT will start an internal
NATS client and connect to the local NATS server. This internal client will
authenticate to the NATS server with a superuser, whose account has full
permissions to publish and subscribe to all subjects. Unauthenticated NATS
clients only have permission to publish to authsubject and listen for a
reply.
Authentication / Login
External NATS clients (including web browsers over WebSockets) must first log
into the NATS server anonymously (using the auth token if needed) and send a
request to the auth subject with the username and password of a valid user
node. The default username is admin, and the default password is admin. The
internal NATS client will subscribe to requests on the auth subject, and if
the username / password is correct, it will respond with a user NKey and user
JWT Token, which are needed to login. The user JWT token will be issued and
signed by the account NKey, and the account NKey will be issued and signed by
the operator NKey. The NATS connection will then be re-established using the
user JWT and signing a server nonce with the user’s NKey.
JWT expiration should be a configurable SIOT option and default to 1 hour.
Optionally, when the user JWT token is approaching its expiration, the NATS
client can request re-authenticate using the auth subject and reconnect using
the new user credentials.
Storing NKeys
As discussed above, in the root node, we store the seed needed to derive the operator NKey. For user nodes, account and user NKeys are computed as-needed from the node ID, the username, and the password.
Authorization
An authenticated user will have publish / subscribe access to the subject space
of $nodeID.> where $nodeID is the node ID for the authenticated user. The
normal SIOT NATS API will work the same as normal with two notable exceptions:
- The API subjects are prepended with
$nodeID. - The “root” node is remapped to the set of parents of the logged in user node
Examples
Example #1
Imagine the following a SIOT node tree:
- Root (Device 82ad…28ae)
- Power Users (Group b723…008d)
- Temperature Sensor (Device 2820…abdc)
- Humidity Sensor (Device a89f…eda9)
- Blake (User ab12…ef22)
- Admin (User 920d…ab21)
In this case, logging in as “Blake” would reveal the following tree with a single root node:
- Power Users (Group b723…008d)
- Temperature Sensor (Device 2820…abdc)
- Humidity Sensor (Device a89f…eda9)
- Blake (User ab12…ef22)
To get points of the humidity sensor, one would send a request to this subject:
ab12...ef22.p.a89f...eda9.
Example #2
Imagine the following a SIOT node tree:
- Root (Device 82ad…28ae)
- Temperature Sensor (Device 2820…abdc)
- Blake (User ab12…ef22)
- Humidity Sensor (Device a89f…eda9)
- Blake (User ab12…ef22)
- Admin (User 920d…ab21)
- Temperature Sensor (Device 2820…abdc)
In this case, logging in as “Blake” would reveal the following tree with two root nodes:
- Temperature Sensor (Device 2820…abdc)
- Blake (User ab12…ef22)
- Humidity Sensor (Device a89f…eda9)
- Blake (User ab12…ef22)
To get points of the humidity sensor, one would send a request to this subject:
ab12...ef22.p.a89f...eda9.
Implementation Notes
// Note: JWT issuer and subject must match an NKey public key
// Note: JWT issuer and subject must match roles depending on the claim NKeys

import (
	"github.com/nats-io/jwt/v2"
	"github.com/nats-io/nkeys"
	"github.com/nats-io/nats-server/v2/server"
)

// Example code to start NATS server
func StartNatsServer(o Options) {
	op, err := nkeys.CreateOperator()
	if err != nil {
		log.Fatal("Error creating NATS server: ", err)
	}
	pubKey, err := op.PublicKey()
	if err != nil {
		log.Fatal("Error creating NATS server: ", err)
	}
	acctResolver := server.MemAccResolver{}
	opts := server.Options{
		Port:                     o.Port,
		HTTPPort:                 o.HTTPPort,
		Authorization:            o.Auth,
		// First we trust all operators
		// Note: DO NOT USE conflicting `TrustedKeys` option
		TrustedOperators:         []{jwt.NewOperatorClaims(pubKey)},
		AccountResolver:          acctResolver,
	}
}

// Create an Account
acct, err := nkeys.CreateAccount()
if err != nil {
	log.Fatal("Error creating NATS account: ", err)
}
pubKey, err := acct.PublicKey()
if err != nil {
	log.Fatal("Error creating NATS account: ", err)
}
claims := jwt.NewAccountClaims{pubKey}
claims.DefaultPermissions = Permissions{
	// Note: subject `_INBOX.>` allowed for all NATS clients
	// Note: subject publish on `auth` allowed for all NATS clients
	Pub: Permission{
		Allow: StringList([]string{userNodeID+".>"}),
	},
	Sub: Permission{
		Allow: StringList([]string{userNodeID+".>"}),
	},
}
claims.Issuer = opPubKey
claims.Name = userNodeID
// Sign the JWT with the operator NKey
jwt, err := claims.Encode(op)
if err != nil {
	log.Fatal("Error creating NATS account: ", err)
}

acctResolver.Store(userNodeID, jwt)
Node Lifecycle
- Author: Cliff Brake, last updated: 2022-02-16
- PR/Discussion:
- Status: discussion
Context
In the process of implementing a feature to duplicate a node tree, several problems have surfaced related to the lifecycle of creating and updating nodes.
Node creation (< 0.5.0)
- if a point was sent and node did not exist, SIOT created a “device” node as a child of the root node with this point. This was based on this initial use of SIOT with 1-wire devices.
- there is also a feature where if we send a point to a Device node that does not have an upstream path to root, or that path is tombstoned, we create this path. This ensures that we don’t have orphaned device nodes in an upstream if they are still active. This happens to the root node on clear startup.
- by the user in the UI – Http API,
/v1/nodesPOST, accepts a NodeEdge struct and then sends out node points and then edge points via NATs to create the node. - node is sent first, then the edge
The creation process for a node involves:
- sending all the points of a node including a meta point with the node type.
- sending the edge points of a node to describe the upstream connection
There are two problems with this:
- When creating a node, we send all the node points, then the edge points. However this can create an issue in that an upstream edge for a device node does not exist yet, so in a multi-level upstream configuration A->B->C, if B is syncing to C for the first time, multiple instances of A will be created on C.
- If a point is sent for a node that does not exist, a new device node will be created.
An attempt was made to switch the sending edge points of new nodes before node points, however this created other issues (this was some time ago, so don’t recall exactly what they were).
Node creation (>= 0.5.0)
With the switch to a SQLite store, a lot of code was rewritten, and in the process we changed the order of creating nodes to:
- send the edge points first
- then send node points
(See the SendNode() function).
discussion
Sending node and edge points separately for new nodes creates an issue in that these don’t happen in one communication transaction, so there is a period of time between the two where the node state is indeterminate. Consideration was given to adding a NATS endpoint to create nodes where everything could be sent at once. However, this is problematic in that now there is another NATS subject for everyone to listen to and process, rather than just listening for new points. It seems less than ideal to have multiple subjects that can create/modify node points.
It seems at this point we can probably deprecate the feature to create new devices nodes based on a single point. This will force new nodes to be explicitly created. This is probably OK as new nodes are created in several ways:
- by the user in the UI
- by the upstream sync mechanism – if the hash does match or a node does not exist upstream, it is sent. This is continuously checked so if a message does not succeed, it will eventually get resent.
- plug-n-play discovery mechanisms that detect new devices and automatically populate new nodes. Again, it is not a big deal if a message gets lost as the discovery mechanism will continue to try to create the new device if it does not find it.
Sending edge before parents can be problematic for things like the client manager that might be listening for tombstone points to detect node creation/deletion. (Why is this???)
Decision
Consequences
Time storage/format considerations
- Author: Cliff Brake, last updated: 2023-02-11
- PR/Discussion:
- Status: accepted
Contents
Problem
How can we store timestamps that are:
- efficient
- high resolution (ns)
- portable
- won’t run out of time values any time soon
We have multiple domains:
- Go
- MCU code
- Browser (ms resolution)
- SQLite
- Protbuf
Two questions:
- How should we store timestamps in SQLite?
- How should we transfer timestamps over the wire (typically protobuf)?
Context
We currently use Go timestamps in Go code, and protobuf timestamps on the wire.
Reference/Research
Browsers
Browsers limit time resolution to MS for security reasons.
64-bit nanoseconds
2 ^ 64 nanoseconds is roughly ~ 584.554531 years.
https://github.com/jbenet/nanotime
NTP
For NTP time, the 64bits are broken in to seconds and fraction of seconds. The top 32 bits is the seconds. The bottom 32 bits is the fraction of seconds. You get the fraction by dividing the fraction part by 2^32.
Linux
64-bit Linux systems are using 64bit timestamps (time_t) for seconds, and 32-bit systems are switching to 64-bit to avoid the 2038 bug.
The Linux clock_gettime() function uses the following datatypes:
struct timeval {
	time_t          tv_sec;
	suseconds_t     tv_usec;
};
struct timespec {
	time_t          tv_sec;
	long            tv_nsec;
};
Windows
Windows uses a 64-bit value representing the number of 100-nanosecond intervals since January 1, 1601 (UTC).
Go
The Go Time type is fairly intelligent as it uses Montonic time when possible and falls back to wall clock time when needed:
https://pkg.go.dev/time
If Times t and u both contain monotonic clock readings, the operations t.After(u), t.Before(u), t.Equal(u), and t.Sub(u) are carried out using the monotonic clock readings alone, ignoring the wall clock readings. If either t or u contains no monotonic clock reading, these operations fall back to using the wall clock readings.
The Go Time type is fairly clever:
type Time struct {
        // wall and ext encode the wall time seconds, wall time nanoseconds,
        // and optional monotonic clock reading in nanoseconds.
        //
        // From high to low bit position, wall encodes a 1-bit flag (hasMonotonic),
        // a 33-bit seconds field, and a 30-bit wall time nanoseconds field.
        // The nanoseconds field is in the range [0, 999999999].
        // If the hasMonotonic bit is 0, then the 33-bit field must be zero
        // and the full signed 64-bit wall seconds since Jan 1 year 1 is stored in ext.
        // If the hasMonotonic bit is 1, then the 33-bit field holds a 33-bit
        // unsigned wall seconds since Jan 1 year 1885, and ext holds a
        // signed 64-bit monotonic clock reading, nanoseconds since process start.
        wall uint64
        ext  int64

        // loc specifies the Location that should be used to
        // determine the minute, hour, month, day, and year
        // that correspond to this Time.
        // The nil location means UTC.
        // All UTC times are represented with loc==nil, never loc==&utcLoc.
        loc *Location
}
Go provides a UnixNano() function that converts a Timestamp to nanoseconds elapsed since January 1, 1970 UTC.
To go the other way, Go provides a
UnixMicro() function to convert
microseconds since 1970 to a timestamp. The
source code
could probably be modified to create a UnixNano() function.
// UnixMicro returns the local Time corresponding to the given Unix time,
// usec microseconds since January 1, 1970 UTC.
func UnixMicro(usec int64) Time {
	return Unix(usec/1e6, (usec%1e6)*1e3)
}

// Unix returns the local Time corresponding to the given Unix time,
// sec seconds and nsec nanoseconds since January 1, 1970 UTC.
// It is valid to pass nsec outside the range [0, 999999999].
// Not all sec values have a corresponding time value. One such
// value is 1<<63-1 (the largest int64 value).
func Unix(sec int64, nsec int64) Time {
	if nsec < 0 || nsec >= 1e9 {
		n := nsec / 1e9
		sec += n
		nsec -= n * 1e9
		if nsec < 0 {
			nsec += 1e9
			sec--
		}
	}
	return unixTime(sec, int32(nsec))
}
Protobuf
The Protbuf time format also has sec/ns sections:
message Timestamp {
  // Represents seconds of UTC time since Unix epoch
  // 1970-01-01T00:00:00Z. Must be from 0001-01-01T00:00:00Z to
  // 9999-12-31T23:59:59Z inclusive.
  int64 seconds = 1;

  // Non-negative fractions of a second at nanosecond resolution. Negative
  // second values with fractions must still have non-negative nanos values
  // that count forward in time. Must be from 0 to 999,999,999
  // inclusive.
  int32 nanos = 2;
}
MQTT
Note sure yet if MQTT defines a timestamp format.
Sparkplug does:
timestamp
- This is the timestamp in the form of an unsigned 64-bit integer representing the number of milliseconds since epoch (Jan 1, 1970). It is highly recommended that this time is in UTC. This timestamp is meant to represent the time at which the message was published
CRDTs
LWW (last write wins) CRDTs often use a logical clock. crsql uses a 64-bit logical clock.
Do we need nanosecond resolution?
Many IoT systems only support MS resolution. However, this is sometimes cited as a deficiency in applications where higher resolution is needed (e.g. power grid).
Decision
- NATS messages
- stick with standard protobuf Time definition in NATS packets
- this is most compatible with all the protobuf language support out there
- Database
- switch to single time field that contains NS since Unix epoch
- this is simpler and allows us to easily do comparisons on the field
objections/concerns
Consequences
Migration is required for database, but should be transparent to the user.
Time Validation
- Author: Cliff Brake
- PR/Discussion:
- Status: discussion
Contents
Problem
To date, SIOT has been deployed to systems with RTCs and solid network connections, so time is fairly stable, thus this has not been a big concern. However, we are looking to deploy to edge systems, some with cellular modem connections and some without a battery backed RTC, so they may boot without a valid time.
SIOT is very dependent on data having valid timestamps. If timestamps are not correct, the following problems may occur:
- old data may be preferred over newer data in the point CRDT merge algorithm
- data stored in time series databases may have the wrong time stamps
Additionally, there are edge systems that don’t have a real-time clock and power up with an invalid time until a NTP process gets the current time.
We may need some systems to operate (run rules, etc) without a valid network connection (offline) and valid time.
Context/Discussion
Clients affected
- db (InfluxDB driver)
- sync (sends data upstream)
- store (not sure ???)
The db and sync clients should not process points (or perhaps buffer them until) until we are sure the system has a valid time. How does it get this information? Possibilities include:
- creating a broadcast or other special message subject that clients can optionally listen to. Perhaps the NTP client can send this message.
- synchronization may be a problem here if NTP client sends messages before a client has started.
- query for system state, and NTP sync status could be a field in this state.
- should this be part of the root device node?
- or a special hard-coded message?
- it would be useful to track system state as a standard point so it gets synchronized and stored in influxdb, therefore as part of the root node would be useful, or perhaps the NTP node.
Offline operation
System must function when offline without valid time. Again, for the point merge algorithm to work correctly, timestamps for new points coming into the store must be newer than what is currently stored. There are two possible scenarios:
- Problem: system powers up with old time, and points in DB have newer time.
- Solution: if we don’t have a valid NTP time, then set system time to something later than the newest point timestamp in the store.
- Problem: NTP sets the time “back” and there are newer points in the DB.
- Solution: when we get a NTP time sync, verify it is not significantly earlier than the latest point timestamp in the system. If it is, update the point timestamps in the DB that are newer than the current time with the current time - 1yr. This ensures that settings upstream (which are likely newer than the edge device) will update the points in the edge device. This is not perfect, but if probably adequate for most systems.
We currently don’t queue data when an edge device is offline. This is a different concern which we will address later.
The SIOT synchronization and point merge algorithm are designed to be simple and bandwidth efficient (works over Cat-M/NBIOT modems). There are design trade-offs. It is not a full-blown replicated, log-based database that will work correctly in every situation. It is designed so that changes can be made in multiple locations while disconnected and when a connection is resumed, that data is merged intelligently. Typically, configuration changes are made at the portal, and sensor data is generated at the edge, so this works well in practice. When in doubt, we prioritize changes made on the upstream (typically cloud instance), as that is the most user accessible system and is where most configuration changes will be made. Sensor data is updated periodically, so that will automatically get refreshed typically within 15m max. The system works best when we have a valid time at every location so we advise ensuring reliable network connections for every device, and at a minimum have a reliable battery backed RTC in every device.
Tracking the latest point timestamp
It may make sense to write the latest point timestamp to the store meta table.
Syncing time from Modem or GPS
Will consider in future. Assume a valid network connection to NTP server for now.
Tracking events where time is not correct
It would be very useful to track events at edge devices where time is not correct and it requires a big jump to be corrected.
TODO: how can we determine this? From systemd-timedated logs?
This information could be used to diagnose when a RTC battery needs replaced, etc.
Verify time matches between synchronized instances
A final check that may be useful is to verify time between synchronized instances are relatively close. This is a final check to ensure the sync algorithm does not wreak havoc between systems, even if NTP is lying.
Reference/Research
NTP
- https://wiki.archlinux.org/title/systemd-timesyncd
timedatectl statusproduces following output:
               Local time: Thu 2023-06-01 18:22:23 EDT
           Universal time: Thu 2023-06-01 22:22:23 UTC
                 RTC time: Thu 2023-06-01 22:22:23
                Time zone: US/Eastern (EDT, -0400)
System clock synchronized: yes
              NTP service: active
          RTC in local TZ: no
There is a systemd-timedated D-Bus API.
Decision
what was decided.
objections/concerns
Consequences
what is the impact, both negative and positive.
Additional Notes/Reference
Time storage in rule schedules
- Author: Cliff Brake, last updated: 2023-07-10
- PR/Discussion:
- Status: discussion
Problem
When storing times/dates in rule schedules, we store time as UTC, but this can be problematic when there is a time change. In once application, SIOT plays a chime at a certain time of day, but when time changes (daylight savings time), we need to adjust the time in the rule and this is easy to forget.
Context/Discussion
UTC was chosen as the storage format for the following reasons:
- it is universal – it always means the same thing everywhere
- typically in UI or reports, times are translated to users local times
- server and edge devices can operate in UTC without needing to worry about local time
- rules run on cloud instances have a common timebase to work from. In a highly distributed system, you may have device in one timezone trigger an action in another time zone.
However, must applications (building automation, etc.) run in a single location, and the loss or gain of an hour when the time changes is very inconvenient.
Reference/Research
Decision
what was decided.
objections/concerns
Consequences
what is the impact, both negative and positive.
Additional Notes/Reference
JetStream SIOT Store
- Author: Cliff Brake, last updated: 2026-08-07
- Status: in progress (stages 1-2 complete; stage 3 initial implementation complete, follow-on work remaining)
This document records the design and the reasoning that led to it. For how the store behaves today — retention, compression, payload limits, and the settings that control each — see the store reference, which is kept current as the implementation moves. Where the two disagree, the reference describes what the code does.
Problem
SQLite has worked well as a SIOT store. There are a few things we would like to improve:
- Synchronization of history
- Currently, if a device or server is offline, only the latest state is transferred when connected. We would like all history that has accumulated when offline to be transferred once reconnected.
- We want history at the edge as well as cloud
- This allows us to use history at the edge to run more advanced algorithms like AI
- We currently have to re-compute hashes all the way to the root node anytime
something changes
- This may not scale to larger systems
- Is difficult to get right if things are changing while we re-compute hashes
- it requires some type of coordination between the distributed systems, which we currently don’t have.
Context/Discussion
The purpose of this document is to explore storing SIOT state in a NATS JetStream store. SIOT data is stored in a tree of nodes and each node contains an array of points. Note, the term “node” in this document represents a data structure in a tree, not a physical computer or SIOT instance. The term “instance” will be used to represent devices or SIOT instances.
Nodes are arranged in a directed acyclic graph.
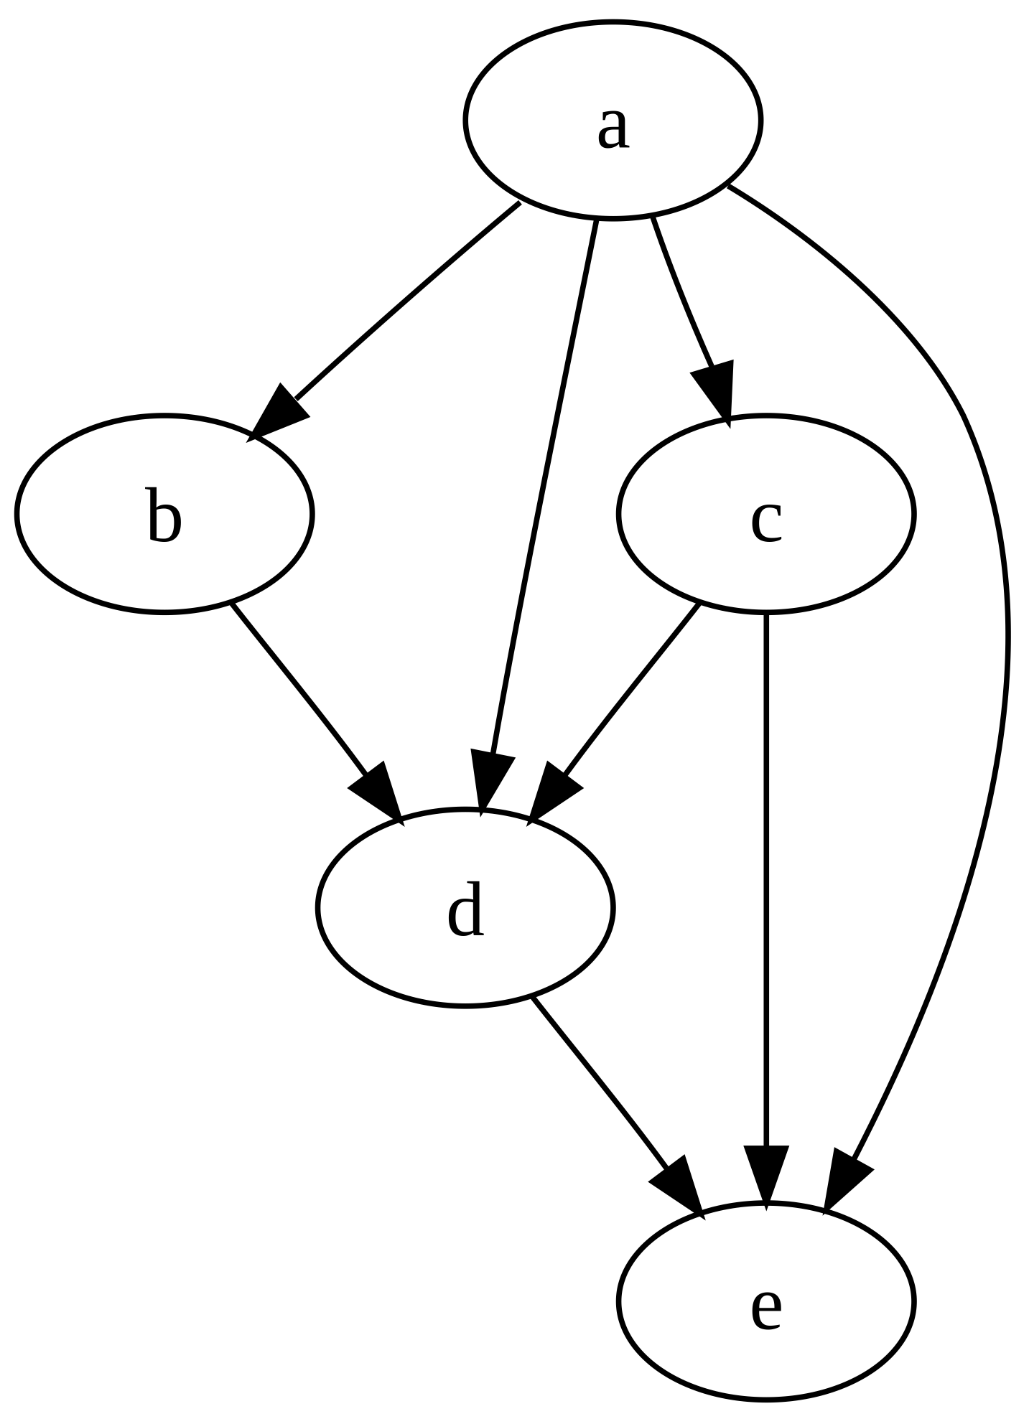
A subset of this tree is synchronized between various instances as shown in the below example:
The tree topology can be as deep as required to describe the system. To date, only the current state of a node is synchronized and history (if needed) is stored externally in a time-series database like InfluxDB and is not synchronized. The node tree is an excellent data model for IoT systems.
Each node contains an array of points that represent the state of the node. The points contain a type and a key. The key can be used to describe maps and arrays. We keep points separate so they can all be updated independently and easily merged.
With JetStream, we could store points in a stream where the head of the stream represents the current state of a Node or collection of nodes. Each point is stored in a separate NATS subject.
NATS JetStream is a stream-based store where every message in a stream is given a sequence number. Synchronization is simple in that if a sequence number does not exist on a remote system, the missing messages are sent.
NATS also supports leaf nodes (instances) and streams can be synchronized between hub and leaf instances. If they are disconnected, then streams are “caught up” after the connection is made again.
Several experiments have been run to understand the basic JetStream functionality in this repo.
- Storing and extracting points in a stream
- Using streams to store time-series data and measure performance
- Syncing streams between the hub and leaf instances
Advantages of JetStream
- JetStream is built into NATS, which we already embed and use.
- History can be stored in a NATS stream instead of externally. Currently, we use an external store like InfluxDB to store history.
- JetStream streams can be synchronized between instances.
- JetStream has various retention models so old data can automatically be dropped.
- Leverage the NATS AuthN/AuthZ features.
- JetStream is a natural extension of core NATS, so many of the core SIOT concepts are still valid and do not need to change.
Challenges with moving to JetStream
- Streams are typically synchronized in one direction. This is a challenge for SIOT as the basic premise is data can be modified in any location where a user/device has proper permissions. A user may change a configuration in a cloud portal or on a local touch-screen.
- Sequence numbers must be set by one instance, so you can’t have both a leaf and hub nodes inserting data into a single stream. This has benefits in that it is a very simple and reliable model.
- We are constrained by a simple message subject to label and easily query data. This is less flexible than an SQL database, but this constraint can also be an advantage in that it forces us into a simple and consistent data model.
- SQLite has a built-in cache. We would likely need to create our own with JetStream.
JetStream consistency model
From this discussion:
When the doc mentions immediate consistency, it is in contrast to eventual consistency. It is about how ‘writes’ (i.e. publishing a message to a stream).
JetStream is an immediately consistent distributed storage system in that every new message stored in the stream is done so in a unique order (when those messages reach the stream leader) and that the acknowledgment that the storing of the message has been successful only happens as the result of a RAFT vote between the NATS JetStream servers (e.g. 3 of them if replicas=3) handling the stream.
This means that when a publishing application receives the positive acknowledgement to it’s publication to the stream you are guaranteed that everyone will see that new message in their updates in the same order (and with the same sequence number and time stamp).
This ‘non-eventual’ consistency is what enables ‘compare and set’ (i.e. compare and publish to a stream) operations on streams: because there can only be one new message added to a stream at a time.
To map back to those formal consistency models it means that for writes, NATS JetStream is Linearizable.
Currently SIOT uses a more “eventually” consistent model where we used data structures with some light-weight CRDT proprieties. However, this has the disadvantage that we have to do things like hash the entire node tree to know if anything has changed. In a more static system where not much is changing, this works pretty well, but in a dynamic IoT system where data is changing all the time, it is hard to scale this model.
Message/Subject encoding
In the past, we’ve used the Point data structure. This has worked extremely well at representing reasonably complex data structures (including maps and arrays) for a node. Yet it has limitations and constraints that have proven useful it making data easy to store, transmit, and merge.
// Point is a flexible data structure that can be used to represent
// a sensor value or a configuration parameter.
// ID, Type, and Index uniquely identify a point in a device
type Point struct {
	//-------------------------------------------------------
	//1st three fields uniquely identify a point when receiving updates

	// Type of point (voltage, current, key, etc)
	Type string `json:"type,omitempty"`

	// Key is used to allow a group of points to represent a map or array
	Key string `json:"key,omitempty"`

	//-------------------------------------------------------
	// The following fields are the values for a point

	// Time the point was taken
	Time time.Time `json:"time,omitempty" yaml:"-"`

	// Instantaneous analog or digital value of the point.
	// 0 and 1 are used to represent digital values
	Value float64 `json:"value,omitempty"`

	// Optional text value of the point for data that is best represented
	// as a string rather than a number.
	Text string `json:"text,omitempty"`

	// catchall field for data that does not fit into float or string --
	// should be used sparingly
	Data []byte `json:"data,omitempty"`

	//-------------------------------------------------------
	// Metadata

	// Used to indicate a point has been deleted. This value is only
	// ever incremented. Odd values mean point is deleted.
	Tombstone int `json:"tombstone,omitempty"`

	// Where did this point come from. If from the owning node, it may be blank.
	Origin string `json:"origin,omitempty"`
}
With JetStream, the Typeand Key can be encoded in the message subject:
p.<node id>.<type>.<key>
Message subjects are indexed in a stream, so NATS can quickly find messages for any subject in a stream without scanning the entire stream (see discussion 1 and discussion 2).
Over time, the Point structure has been simplified. For instance, it used to
also have an Index field, but we have learned we can use a single Key field
instead. At this point it may make sense to simplify the payload. One idea is to
do away with the Value and Text fields and simply have a Data field. The
components that use the points have to know the data-type anyway to know if they
should use the Value or Textfield. In the past, Protobuf encoding was used
as we started with quite a few fields and provided some flexibility and
convenience. But as we have reduced the number of fields and two of them are now
encoded in the message subject, it may be simpler to have a simple encoding for
Time, Data, Tombstone, and Origin in the message payload. The code using
the message would be responsible for convert Data into whatever datatype is
needed. This would open up the opportunity to encode any type of payload in the
future in the Data field and be more flexible for the future.
Message payload:
Time(uint64)Tombstone(byte)OriginLen(byte)Origin(string)Data Type(byte)Data(length determined by the message length subtracted by the length of the above fields)
Examples of types:
- 0 - unknown or custom
- 1 - float (32, or 64 bit)
- 2 - int (8, 16, 32, or 64 bit)
- 3 - unit (8, 16, 32, or 65 bit)
- 4 - string
- 5 - JSON
- 6 - Protobuf
Putting Origin in the message subject will make it inefficient to query as you
will need to scan and decode all messages. Are there any cases where we will
need to do this? (this is an example where an SQL database is more flexible).
One solution would be to create another stream where the origin is in the
subject.
There are times when the current point model does not fit very well - for instance when sending a notification - this is difficult to encode in an array of points. I think in these cases encoding the notification data as JSON probably makes more sense and this encoding should work much better.
Can’t send multiple points in a message
In the past, it was common to send multiple points in a message for a node - for
instance when creating a node, or updating an array. However, with the type
and key encoded in the subject this will no longer work. What is the
implication for having separate messages?
- Will be more complex to create nodes
- When updating an array/map in a node, it will not be updated all at once, but over the time it takes all the points to come into the client.
- There is still value in arrays being encoded as points - for instance a relay devices that contains two relays. However, for configuration are we better served by encoding the struct in a the data field as JSON and updating it as an atomic unit?
UI Implications
Because NATS and JetStream subjects overlap, the UI could subscribe to the current state changes much as is done today. A few things would need to change:
- Getting the initial state could still use the
NATS
nodesAPI. However, theValueandTextfields might be merged intoData. - In the
p.<node id>subscription, theTypeandKeynow would come from the message subject.
Bi-Directional Synchronization
Bi-directional synchronization between two instances may be accomplished by having two streams for every node. The head of both incoming and outgoing streams is looked at to determine the current state. If points of the same type exist in both streams, the point with the latest timestamp wins. In reality, 99% of the time, one set of data will be set by the Leaf instance (ex: sensor readings) and another set of data will be set by the upstream Hub instance (ex: configuration settings) and there will be very little overlap.
The question arises - do we really need bi-directional synchronization and the complexity of having two streams for every node? Every node includes some amount of configuration which can flow down from upstream instances. Additionally, many nodes are collecting data which needs to flow back upstream. So it seems a very common need for every node to have data flowing in both directions. Since this is a basic requirement, it does not seem like much of stretch to allow any data to flow in either stream, and then merge the streams at the endpoints where the data is used.
Does it make sense to use NATS to create merged streams?
NATS can source streams into an additional 3rd stream. This might be useful in that you don’t have to read two streams and merge the points to get the current state. However, there are several disadvantages:
- Data would be stored twice
- Data is not guaranteed to be in chronological order - the data would be inserted into the 3rd stream when it is received. So you would still have to walk back in history to know for sure if you had the latest point. It seems simpler to just read the head of two streams and compare them.
Timestamps
NATS JetStream messages store a timestamp, but the timestamp is when the message is inserted into the stream, not necessarily when the sample was taken. There can be some delay between the NATS client sending the message and the server processing it. Therefore, an additional high-resolution 64-bit timestamp is added to the beginning of each message.
Edges
Edges are used to describe the connections between nodes. Nodes can exist in
multiple places in the tree. In the below example, N2 is a child of both N1
and N3.
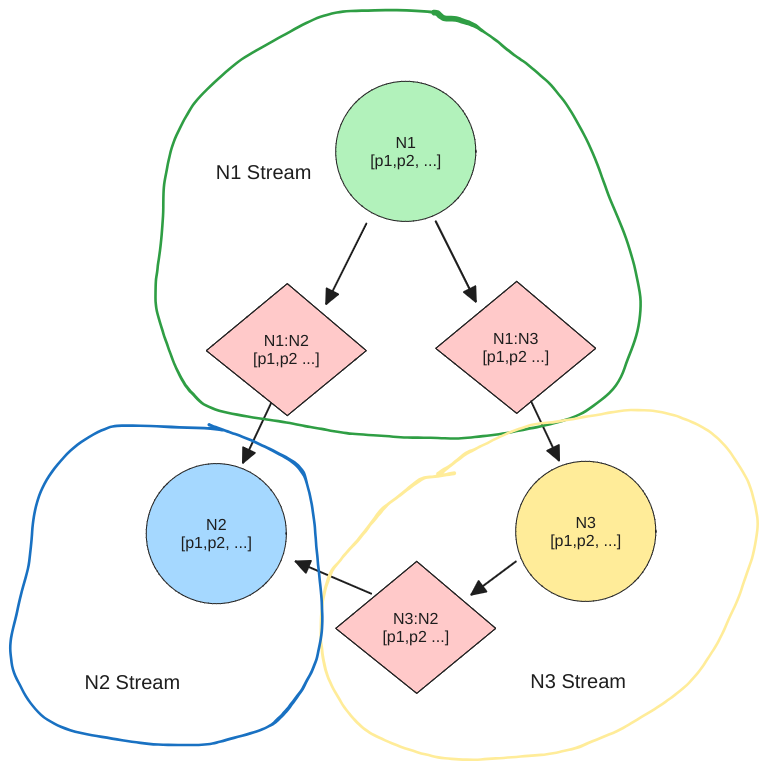
Edges currently contain the up and downstream node IDs, an array of points, and a node type. Putting the type in the edge made it efficient to traverse the tree by loading edges from a SQLite table and indexing the IDs and type. With JetStream it is less obvious how to store the edge information. SIOT regularly traverses up and down the tree.
- Down: to discover nodes
- Up: to propagate points to up subjects
Because edges contain points that can change over time, edge points need to be stored in a stream, much like we do the node points. If each node has its own stream, then the child edges for the node could be stored in the same stream as the node as shown above. This would allow us to traverse the node tree on startup and perhaps cache all the edges. The following subject can be used for edge points:
p.<up node ID>.<down node ID>.<type>.<key>
Again, this is very similar to the existing NATS API.
Two special points are present in every edge:
nodeType: defines the type of the downstream nodetombstone: set to true if the downstream node is deleted
One challenge with this model is much of the code in the SIOT uses a
NodeEdge data structure which includes a node and its parent edge. This
collection of data describes this instance of a node and is more useful from a
client perspective. However, NodeEdge’s are duplicated for every mirrored node
in the tree, so don’t really make sense from a storage and synchronization
perspective. This will likely become more clear after some implementation work.
NATS up.* subjects
In SIOT, we partition the system using the tree structure and nodes that listen
for messages (databases, messaging services, rules, etc.) subscribe to the
up.*stream of their parent node. In the below example, each group has it’s own
database configuration and the Db node only receives points generated in the
group it belongs to. This provides an opportunity for any node at any level in
the tree to listen to messages of another node, as long as:
- It is equal or higher in the structure
- Shares an ancestor.
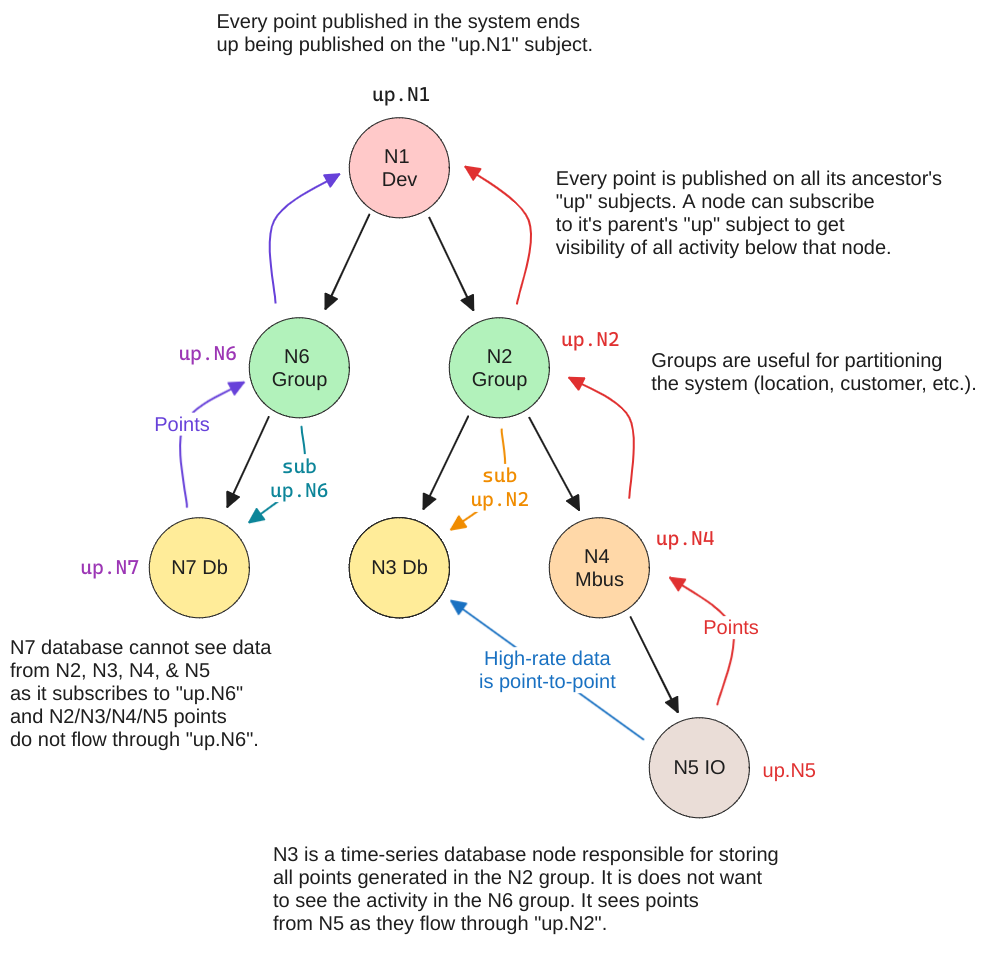
The use of “up” subjects would not have to change other than the logic that re-broadcasts points to “up” subjects would need to use the edge cache instead of querying the SQLite database for edges.
AuthN/AuthZ
Authorization typically needs to happen at device or group boundaries. Devices or users will need to be authorized. Users have access to all nodes in their parent group or device. If each node has its own stream, that will simplify AuthZ. Each device or user are explicitly granted permission to all the Nodes they have access to. If a new node is created that is a child of a node a user has permission to view, this new node (and the subsequent streams) are added to the list.
Are we optimizing the right thing?
Any time you move away from an SQL database, you should think long and hard about this. Additionally, there are very nice time-series database solutions out there. So we should have good reasons for inventing yet-another-database. However, mainstream SQL and Time-series databases all have one big drawback: they don’t support synchronizing subsets of data between distributed systems.
With system design, one approach is to order the problems you are solving by difficulty with the top of the list being most important/difficult, and then optimize the system to solve the hard problems first.
- Synchronizing subsets of data between distributed systems (including history)
- Be small and efficient enough to deploy at the edge
- Real-time response
- Efficient searching through history
- Flexible data storage/schema
- Querying nodes and state
- Arbitrary relationships between data
- Data encode/decode performance
The number of devices and nodes in systems SIOT is targeting is relatively small, thus the current node topology can be cached in memory. The history is a much bigger dataset so using a stream to synchronize, store, and retrieve time-series data makes a lot of sense.
On #7, will we ever need arbitrary relationships between data? With the node graph, we can do this fairly well. Edges contain points that can be used to further characterize the relationship between nodes. With IoT systems your relationships between nodes is mostly determined by physical proximity. A Modbus sensor is connected to a Modbus, which is connected to a Gateway, which is located at a site, which belongs to a customer.
On #8, the network is relatively slow compared to anything else, so if it takes a little more time to encode/decode data this is typically not a big deal as the network is the bottleneck.
With an IoT system, the data is primarily 1) sequential in time, and 2) hierarchical in structure. Thus, the streaming/tree approach still appears to be the best approach.
Questions
Still open:
- How chatty is the NATS Leaf-node protocol? Is it efficient enough to use over low-bandwidth Cat-M cellular connections (~20-100Kbps)? Bandwidth on constrained links has not been measured.
- Are there any other features of NATS/JetStream that we should be considering?
Resolved by the 2026-08-06 revision:
Is it practical to have 2 streams for every node?Per-node streams were replaced by boundary-origin streams; stream count now scales with instance count rather than fleet node count.Would it make sense to create streams at the device/instance boundaries rather than node boundaries?Yes — this is the adopted model. AuthZ within an instance is preserved because boundaries fall where authorization already happens (devices and groups).How robust is the JetStream store compared to SQLite in events like power loss?The file store fsyncs on a 2-minute interval by default, comparable to the prior SQLite WAL exposure;--storeSyncIntervalshortens the window or forces an fsync on every write.
Stream Granularity and Synchronization Model (2026-08-06 revision)
The initial Stage 2 implementation used one stream per node. A design review before merging the store raised two structural concerns with that layout and with the original Stage 3 synchronization sketch, and led to a revised model.
Echo in merge-on-receive synchronization. The original Stage 3 sketch fed points received from a remote instance into the local store’s merge logic, which writes them into local streams. With bi-directional sync, each side then replays the other’s points back to it: the hub writes leaf points into hub streams, and the leaf’s consumer on those streams receives its own points again. Preventing the loop requires origin-based echo suppression on every message, and any defect in that suppression circulates points between instances indefinitely. Merge-on-receive also gives up the single-writer property that motivated JetStream in the first place: each stream becomes a mixture of local writes and republished remote writes, with arrival-order interleaving in the history.
Hub scaling. Per-node streams scale with the total number of nodes in the fleet, not with the number of instances. A hub serving 500 devices with 30 nodes each holds roughly 15,000 streams, each with its own file store and accounting, plus a durable consumer per synced stream per connected leaf. Node creation and deletion become stream administration operations rather than message publishes, and startup enumeration touches every stream.
Alternatives considered:
- One stream per origin instance (an oplog per writer). Sync becomes one
consumer per peer and hub storage scales with instance count.
MaxMsgsPerSubjectretention still works because it applies per subject, not per stream. However, node IDs are UUIDs, so the subject space is flat: selecting a subtree to sync requires maintaining an explicit filter list, and read-side AuthZ inside a single stream depends on filter-constrained consumer permissions, which have sharp edges (single-filter form only, legacy API forms must be denied). - Streams at sync/AuthZ boundaries. Authorization in SIOT naturally happens at device or group boundaries (see AuthN/AuthZ above), and a device subtree syncs as a unit. Making the stream the boundary aligns storage, sync, and permissions, and drops hub stream count to a small multiple of the device count.
- Merge at read instead of on receive. Keep every stream single-writer and replicate remote streams locally (JetStream sourcing or durable consumers). Current state is the merge of subject tips across the local and replica streams, which is exactly the two-stream comparison described in the Bi-Directional Synchronization section above. The in-memory edge and point caches already perform this merge once at load time, so the read-path cost is negligible. Echo is impossible by construction because no instance ever writes remote data into its own streams.
Revised model (adopted): boundary-origin streams, combining 2 and 3:
- A boundary is a node that represents a SIOT instance: the local instance’s root node and any device node that corresponds to a (potentially synced) remote instance. Every node is owned by the nearest boundary found walking up the tree. Nodes above all device boundaries are owned by the instance root boundary.
- Each (boundary, origin instance) pair gets one stream, named
inst_<boundaryID>_<originID>(stream names cannot contain dots, so the subject separator becomes an underscore; node IDs are UUIDs and carry dashes of their own). Theinstprefix identifies both tokens as instances — a boundary is a node representing an instance — and keeps “node” reserved for the data tree. Only instance<originID>ever appends to that stream. - Storage subjects carry both routing tokens so stream subject spaces never
overlap:
inst.<boundaryID>.<originID>.<nodeID>.p.<type>.<key>for node points andinst.<boundaryID>.<originID>.<parentID>.ep.<childID>for edge points. The stream capturesinst.<boundaryID>.<originID>.>. Core NATS wire subjects (p.>,ep.>) are unchanged. - Current state of a node is the merge of subject tips across all
inst_<boundaryID>_*streams present locally, newest timestamp wins. The edge and point caches hold the merged state; merging happens at cache load and as messages arrive. - Trade-offs accepted with this layout: retention (
MaxMsgsPerSubject) is tuned per boundary rather than per node; moving a node across boundaries requires republishing its subject tips into the new stream and purging the old subjects; reads consult one stream per origin that has written to the boundary. Nodes mirrored under multiple parents resolve to a single owner (the instance root boundary when more than one boundary can reach them); mirroring across device boundaries remains an open design point for Stage 3.
Experiments
Several proof-of-concept experiments have been run to prove the feasibility of this:
https://github.com/simpleiot/nats-exp
Decision
Implementation is broken down into 3 stages:
- message/subject encoding changes — COMPLETE
(plan, branch
feat/js-subject-point-changes). Point struct now usesDataType/Datainstead ofValue/Text. Protobuf replaced with binary encoding for point wire format. NATS subjects include type/key (p.<nodeId>.<type>.<key>,ep.<nodeId>.<parentId>). One point per NATS message for node points; edge points remain batched for atomicity. - switch store from SQLite to JetStream — initial implementation COMPLETE
with per-node streams
(plan, branch
feat/js-store); layout revision to boundary-origin streams COMPLETE (plan). See the Stream Granularity and Synchronization Model section for the analysis behind the revision.- Boundary-origin streams: each (boundary, origin instance) pair gets stream
inst_<boundaryID>_<originID>capturing subjectsinst.<boundaryID>.<originID>.<nodeID>.p.<type>.<key>(node points) andinst.<boundaryID>.<originID>.<parentID>.ep.<childID>(edge points, stored with the parent node’s boundary). Only the origin instance appends to a stream. - Streams retain full history (time-series). Current state = merge of subject
tips (via
GetLastMsgForSubject) across the streams for a boundary, newest timestamp wins. Retention usesMaxMsgsPerSubject(notMaxAgeor stream-levelMaxBytes/MaxMsgs) so current state is always preserved, including rarely-updated config points that time/size-based policies could silently drop. - Retention is resolved per stream: the default is 5000 messages per subject
(about a month of 10-minute data, effectively unlimited for configuration
subjects, bounded disk on unattended devices), and the server option
--storeMaxMsgsPerSubject/SIOT_STORE_MAX_MSGS_PER_SUBJECToverrides it (-1 = unlimited). Stage 3 adds per-boundary overrides at the same resolution point. Each instance’s store owns the configuration of every stream on its own disk: sync pumps create replica streams bare and never update existing stream configuration, and the store applies local retention when it discovers a replica, so hub and device retain independently. Changing the value applies to each existing stream the first time it is ensured or discovered after a restart, and JetStream trims existing subjects to the new limit. - Durability: the JetStream file store fsyncs on a 2-minute interval by
default, which is the accepted power-loss window for typical deployments
(comparable exposure to the prior SQLite WAL configuration).
--storeSyncInterval/SIOT_STORE_SYNC_INTERVALaccepts a Go duration to shorten the window, oralwaysto fsync every write for edge devices with unreliable power, trading write throughput. METAKV bucket for instance metadata (rootID, jwtKey).- In-memory edge and point caches hold the merged current state, populated on startup by reading stream tips.
- Hash tree removed; JetStream sequence numbers replace it.
- SQLite removed entirely; migration via
siot export/siot import.
- Boundary-origin streams: each (boundary, origin instance) pair gets stream
- Use JetStream to sync between systems — initial implementation COMPLETE
(plan, branch
feat/js-store-boundary-stream), with follow-on work remaining (see the end of this section).- Each instance runs its own NATS server and owns its origin streams. The
single-writer invariant holds globally: instance R appends only to
inst_*_Rstreams. - Instances connect via NATS leaf/client connections. Each instance keeps local replicas of the remote-origin streams for the boundaries it participates in, using JetStream sourcing (durable consumers as a fallback if sourcing proves unsuitable across leaf connections). Replication is sequence-tracked, so reconnect after network loss delivers only missed messages. No rescan or hash comparison.
- Replicated data stays in the replica streams. There is no merge-on-receive: current state is merged at read in the edge and point caches. Echo cannot occur because no instance writes remote data into its own streams.
- Example: device X (root node ID X, hub root ID R) owns
inst_X_X. The hub writes configuration for X’s subtree to its owninst_X_R. The hub replicatesinst_X_Xfrom the device; the device replicatesinst_X_Rfrom the hub. Multi-hop topologies chain sourcing through intermediate instances. - AuthZ: writes are enforced with core NATS subject permissions (unchanged by
stream layout); reads with per-stream JetStream API permissions. Device X
may replicate
inst_X_*and export onlyinst_X_X. Grants are issued dynamically (NATS auth callout) as the tree changes. - Real-time point delivery continues via core NATS subjects (
p.>,ep.>) as today. Replica catch-up covers only the offline/startup gap. - Prerequisite spikes before implementation: verify JetStream sourcing
behavior across leaf connections/domains, and verify the filter-carrying
consumer-create permission form
(
$JS.API.CONSUMER.CREATE.<stream>.<consumer>.<filter>) on the NATS version SIOT pins. - Spike results (2026-08-06): JetStream sourcing across a leaf connection
with distinct JetStream domains works, including catch-up after the sourced
server restarts (only missed messages delivered); see
store/leafnode_spike_test.go. Chained (multi-hop) sourcing and the consumer-create permission form remain to be verified. - Initial implementation (2026-08-06, plan) uses durable-consumer replication over the existing upstream client connection rather than sourcing: the sync client copies messages between same-named streams subject-for-subject, acknowledging only after the receiving side confirms the write, so reconnects resume with only missed messages. This needs no leafnode listener and no static JetStream domain configuration (domains are server config, while instance identity is only known once the store initializes), and it chains through intermediate instances naturally. Sourcing over leaf connections remains the intended replacement once identity/domain configuration is worked out.
- The receiving store consumes replica streams, merges tips into its caches,
and re-broadcasts changed tips on the core NATS wire subjects tagged with a
Siot-Originheader; a store never persists a wire message tagged with a remote origin. After an offline gap, broadcasts are held until the backlog drains and only final tips are sent, so rules do not replay intermediate values. - Deleting a device node on the hub now detaches it: the device does not force itself back into the tree (the old hash sync re-created it); only the hub can restore the edge.
- Follow-on work is listed in the Remaining Work section below.
- Each instance runs its own NATS server and owns its origin streams. The
single-writer invariant holds globally: instance R appends only to
Remaining Work
Stage 3 is functional end to end — two instances replicate in both directions, survive disconnection, and converge — but the items below are still outstanding. They are grouped by area and roughly ordered by priority within each group. The sync follow-ups plan tracks progress.
Sync coverage
- Nested device boundaries: only the root boundary replicates today, so a device beneath another device’s boundary does not yet sync.
- Multi-hop chaining test: each hop is independent and expected to work, but this is unverified.
- Nodes mirrored across device boundaries: resolved.
OwningBoundaryskips mirror edges, so a device’s node mirrored into a group on the upstream stays owned by the device’s boundary and writes made on the upstream – including avalueSetaimed at the hardware – travel back down and are acted on there (TestSyncMirrorAcrossBoundary). A node with no role, such as a variable or a user, has no mirror edge to skip, so ownership comes from the boundaries themselves: reaching the instance root alongside a device boundary says only that the node is in this instance’s tree, and the device boundary wins (TestSyncMirrorNoRoleAcrossBoundary). Before both, such a node became reachable from two boundaries and resolved to the instance root, so upstream writes landed in a stream the device does not replicate and never arrived. - One node into two devices: resolved for the upstream’s writes. Ownership
still names a single boundary, and a node reachable from two device
boundaries still resolves to the instance root. Separately,
EdgeCache.DeliveryBoundarieslists every device boundary the node is reachable from, mirror edges included, and the instance appends its own writes to its stream for each of them (nodePointsandedgePoints,store/jetstream.go). Adding a mirror seeds the node’s current tips and subtree into that device’s stream and removing it purges them, through the same walk that handles an owner change. The single-writer rule holds, since the instance only ever appends to its own streams. What a device writes still reaches only the upstream; relaying it to the other devices is issue 810. - Moving a node between boundaries: requires republishing subject tips into the new stream and purging the old subjects. Not implemented.
Transport
- JetStream sourcing over leaf connections remains the intended replacement for durable-consumer replication, pending a way to drive server domain configuration from instance identity (identity is known only after the store initializes).
- Chained (multi-hop) sourcing is unverified; the single-hop spike passed
(
store/leafnode_spike_test.go).
Security
- AuthZ tightening: resolved. Per-device credentials scope a device to
replicating
inst_X_*and writing onlyinst_X_X, issued by the server’s own authorizer rather than auth callout (devicePermissionsinserver/auth.go; see the security reference). - The filter-carrying consumer-create permission form: resolved as part of item
8, which grants
$JS.API.CONSUMER.CREATE.<stream>.>.
Operations and observability
- Per-boundary retention overrides: every stream, replicas included, keeps
5000 messages per subject by default. The resolution point exists in
maxMsgsForStream. - History sinks: the Db client consumes boundary-origin streams with a durable
consumer, so node points are gap-free across restarts (
client/db.go), and external sinks can follow the same pattern. Remaining: edge points are excluded by the consumer filter and are not stored, and sink lag is not surfaced. High-rate (phrup) data stays a core NATS subscription by design. - Sync status points: per-replica lag and last-delivered sequence.
SyncCountcurrently counts replication sessions. - Frontend sync status UI: surface lag rather than the former hash and
SyncCountvalues.
Consequences
Positive:
- Every stream is a single-writer, linearizable log with provenance intact. Bi-directional sync cannot echo points between instances.
- Hub storage and consumer counts scale with the number of instances, not with total fleet node count. Node creation and deletion are message publishes, not stream administration.
- Stream boundaries align with sync boundaries and with the natural AuthZ boundaries (devices and groups), so device-level permissions are one rule per device.
- History is retained locally per boundary and synchronizes with the same mechanism as current state.
Negative:
- The store must resolve which boundary owns a node (an edge cache walk) on every write, and boundary resolution rules must be identical on every instance.
- Moving a node across boundaries requires republishing subject tips and purging old subjects; per-node streams handled moves for free.
- Retention is tuned per boundary rather than per node.
- Reads merge tips across one stream per origin instance that has written to the boundary; the in-memory caches hide this cost but must be correct.
- No SQLite fallback; existing users migrate via
siot export/siot import.
Additional Notes/Reference
ADR Title
- Author: NAME, last updated: DATE
- PR/Discussion:
- Status: discussion
Problem
What problem are we trying to solve?
Context/Discussion
background, facts surrounding this discussion.
Reference/Research
links to reference material that may be
Decision
what was decided.
objections/concerns
Consequences
what is the impact, both negative and positive.