Graphing Data
Simple IoT is designed to work with several other applications for storing time series data and viewing this data in graphs.
InfluxDB
InfluxDB is currently the recommended way to store historical data. This database is efficient and can run on embedded platforms like the Raspberry PI as well as desktop and server machines. To connect SIOT to InfluxDB, add a database node and fill in the parameters.
Grafana
Grafana is a very powerful graphing solution that works well with InfluxDB. Although InfluxDB has its own web interface and graphing capability, generally we find Grafana to be more full featured and easier to use.
Changing the Display name (labels) in Grafana
Often with an Influx query, we’ll get trace display names that look like the below:
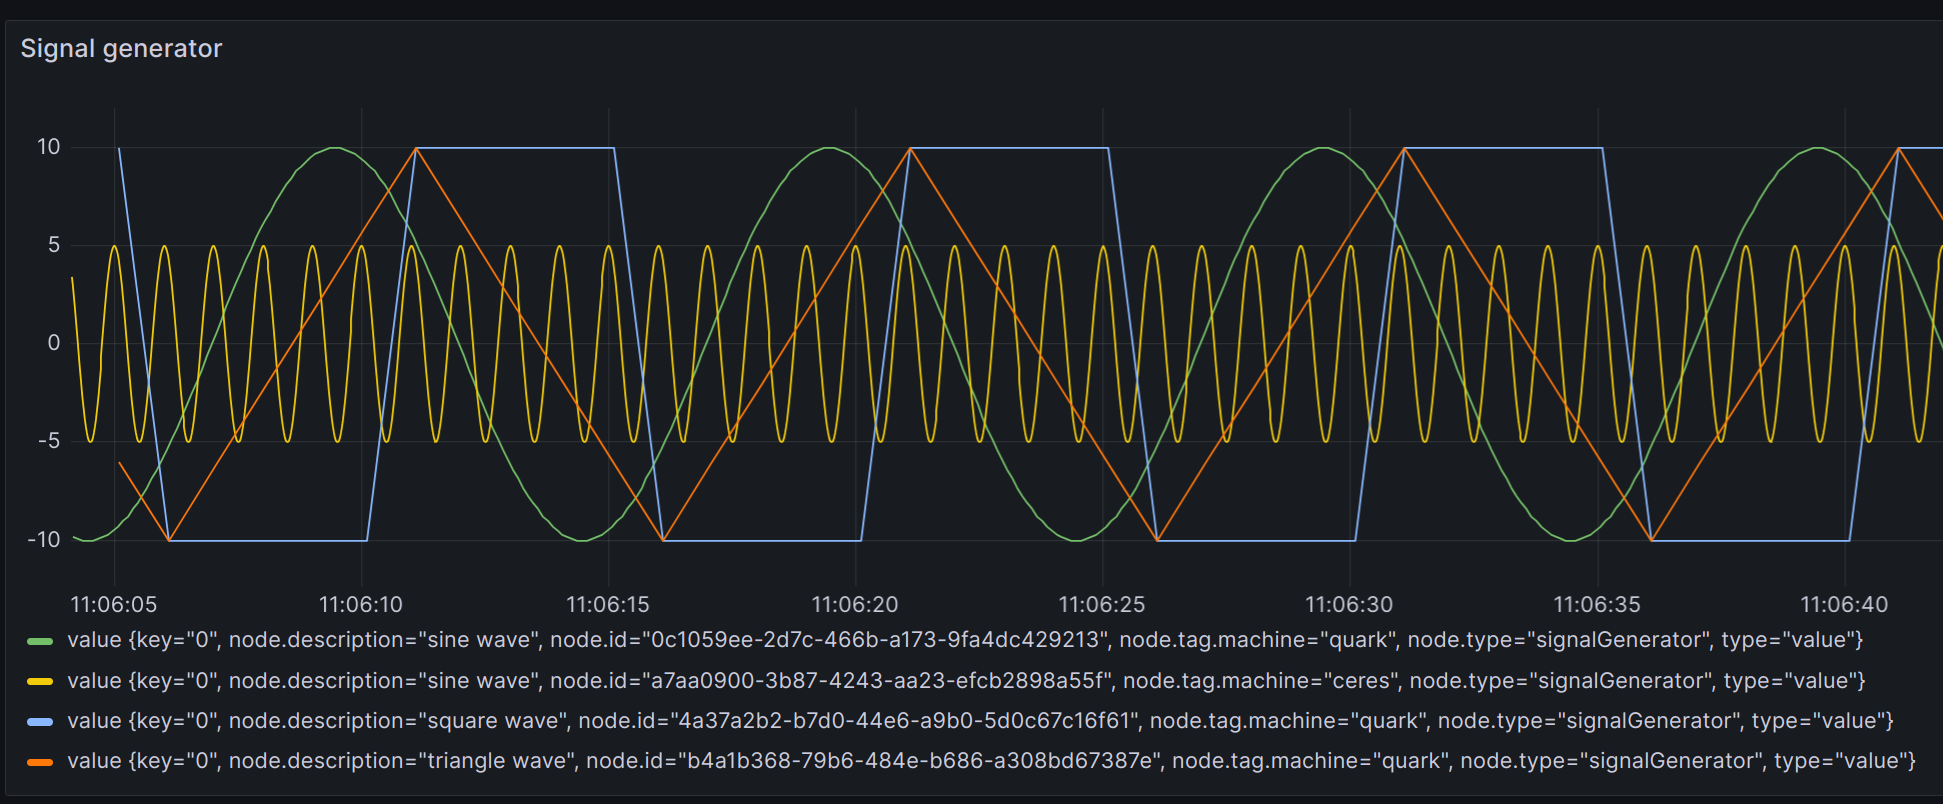
Often, much of this data is irrelevant or redundant with the query. One way to change the label is with an Override:
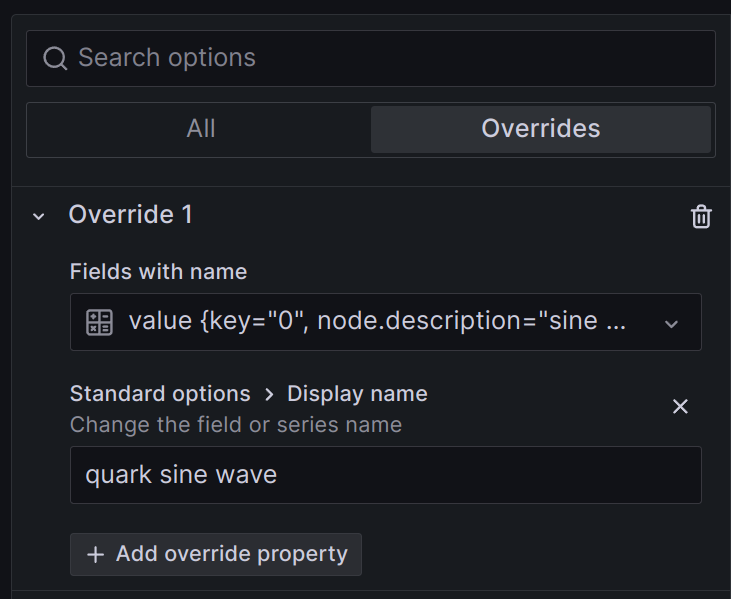
This can be tedious to set up and maintain.
Often a better way is to
add tags
to the nodes generating the data and then display the node tags in the display
name by using the Influx map function.
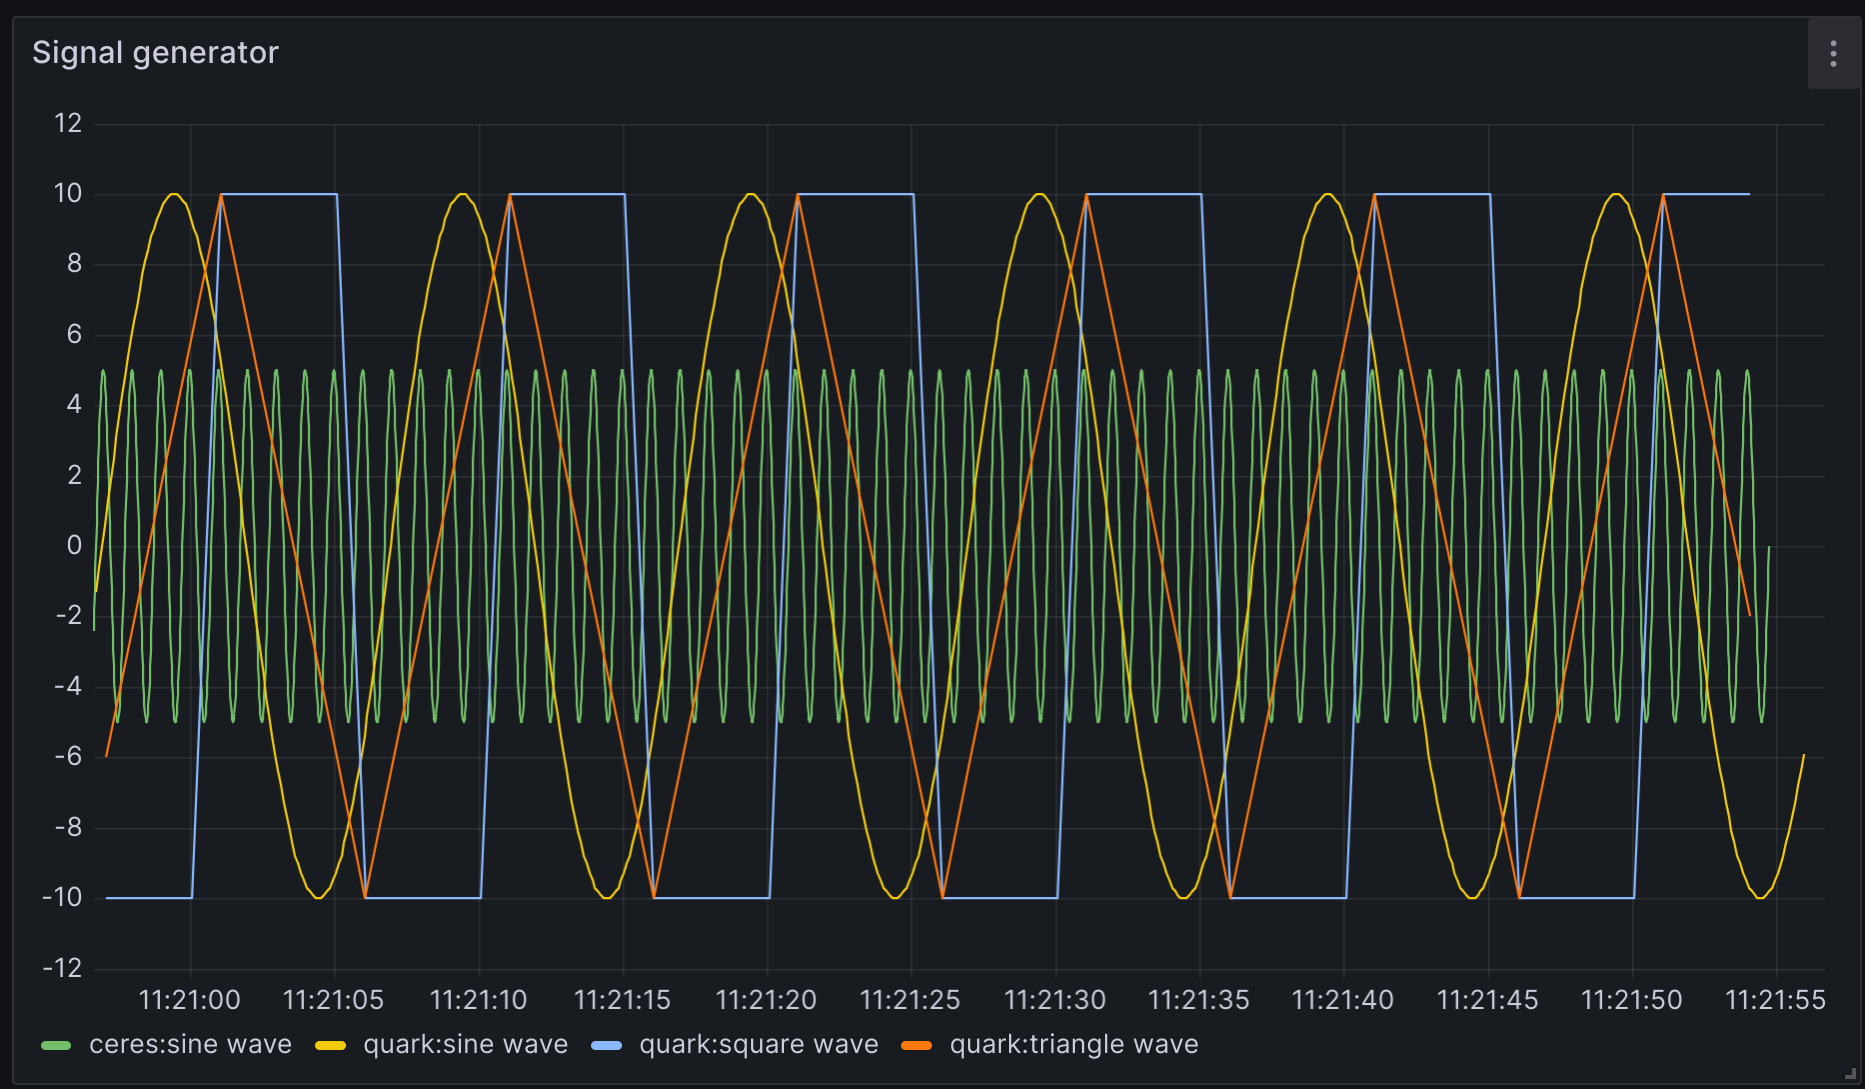
from(bucket: "siot")
  |> range(start: v.timeRangeStart, stop:v.timeRangeStop)
  |> filter(fn: (r) =>
    r._measurement == "points" and
    r._field == "value" and
    r.type == "value")
  |> filter(fn: (r) => r["node.type"] == "signalGenerator")
  |> map(fn: (r) => ({_value:r._value, _time:r._time, _field:r["node.tag.machine"] + ":" + r["node.description"]}))
In this case we are displaying the node machine tag and description. The result is very nice: